Calgary Market Report Infographics
INFOGRAPHICS: May 2026 CREB City And Region Market Reports

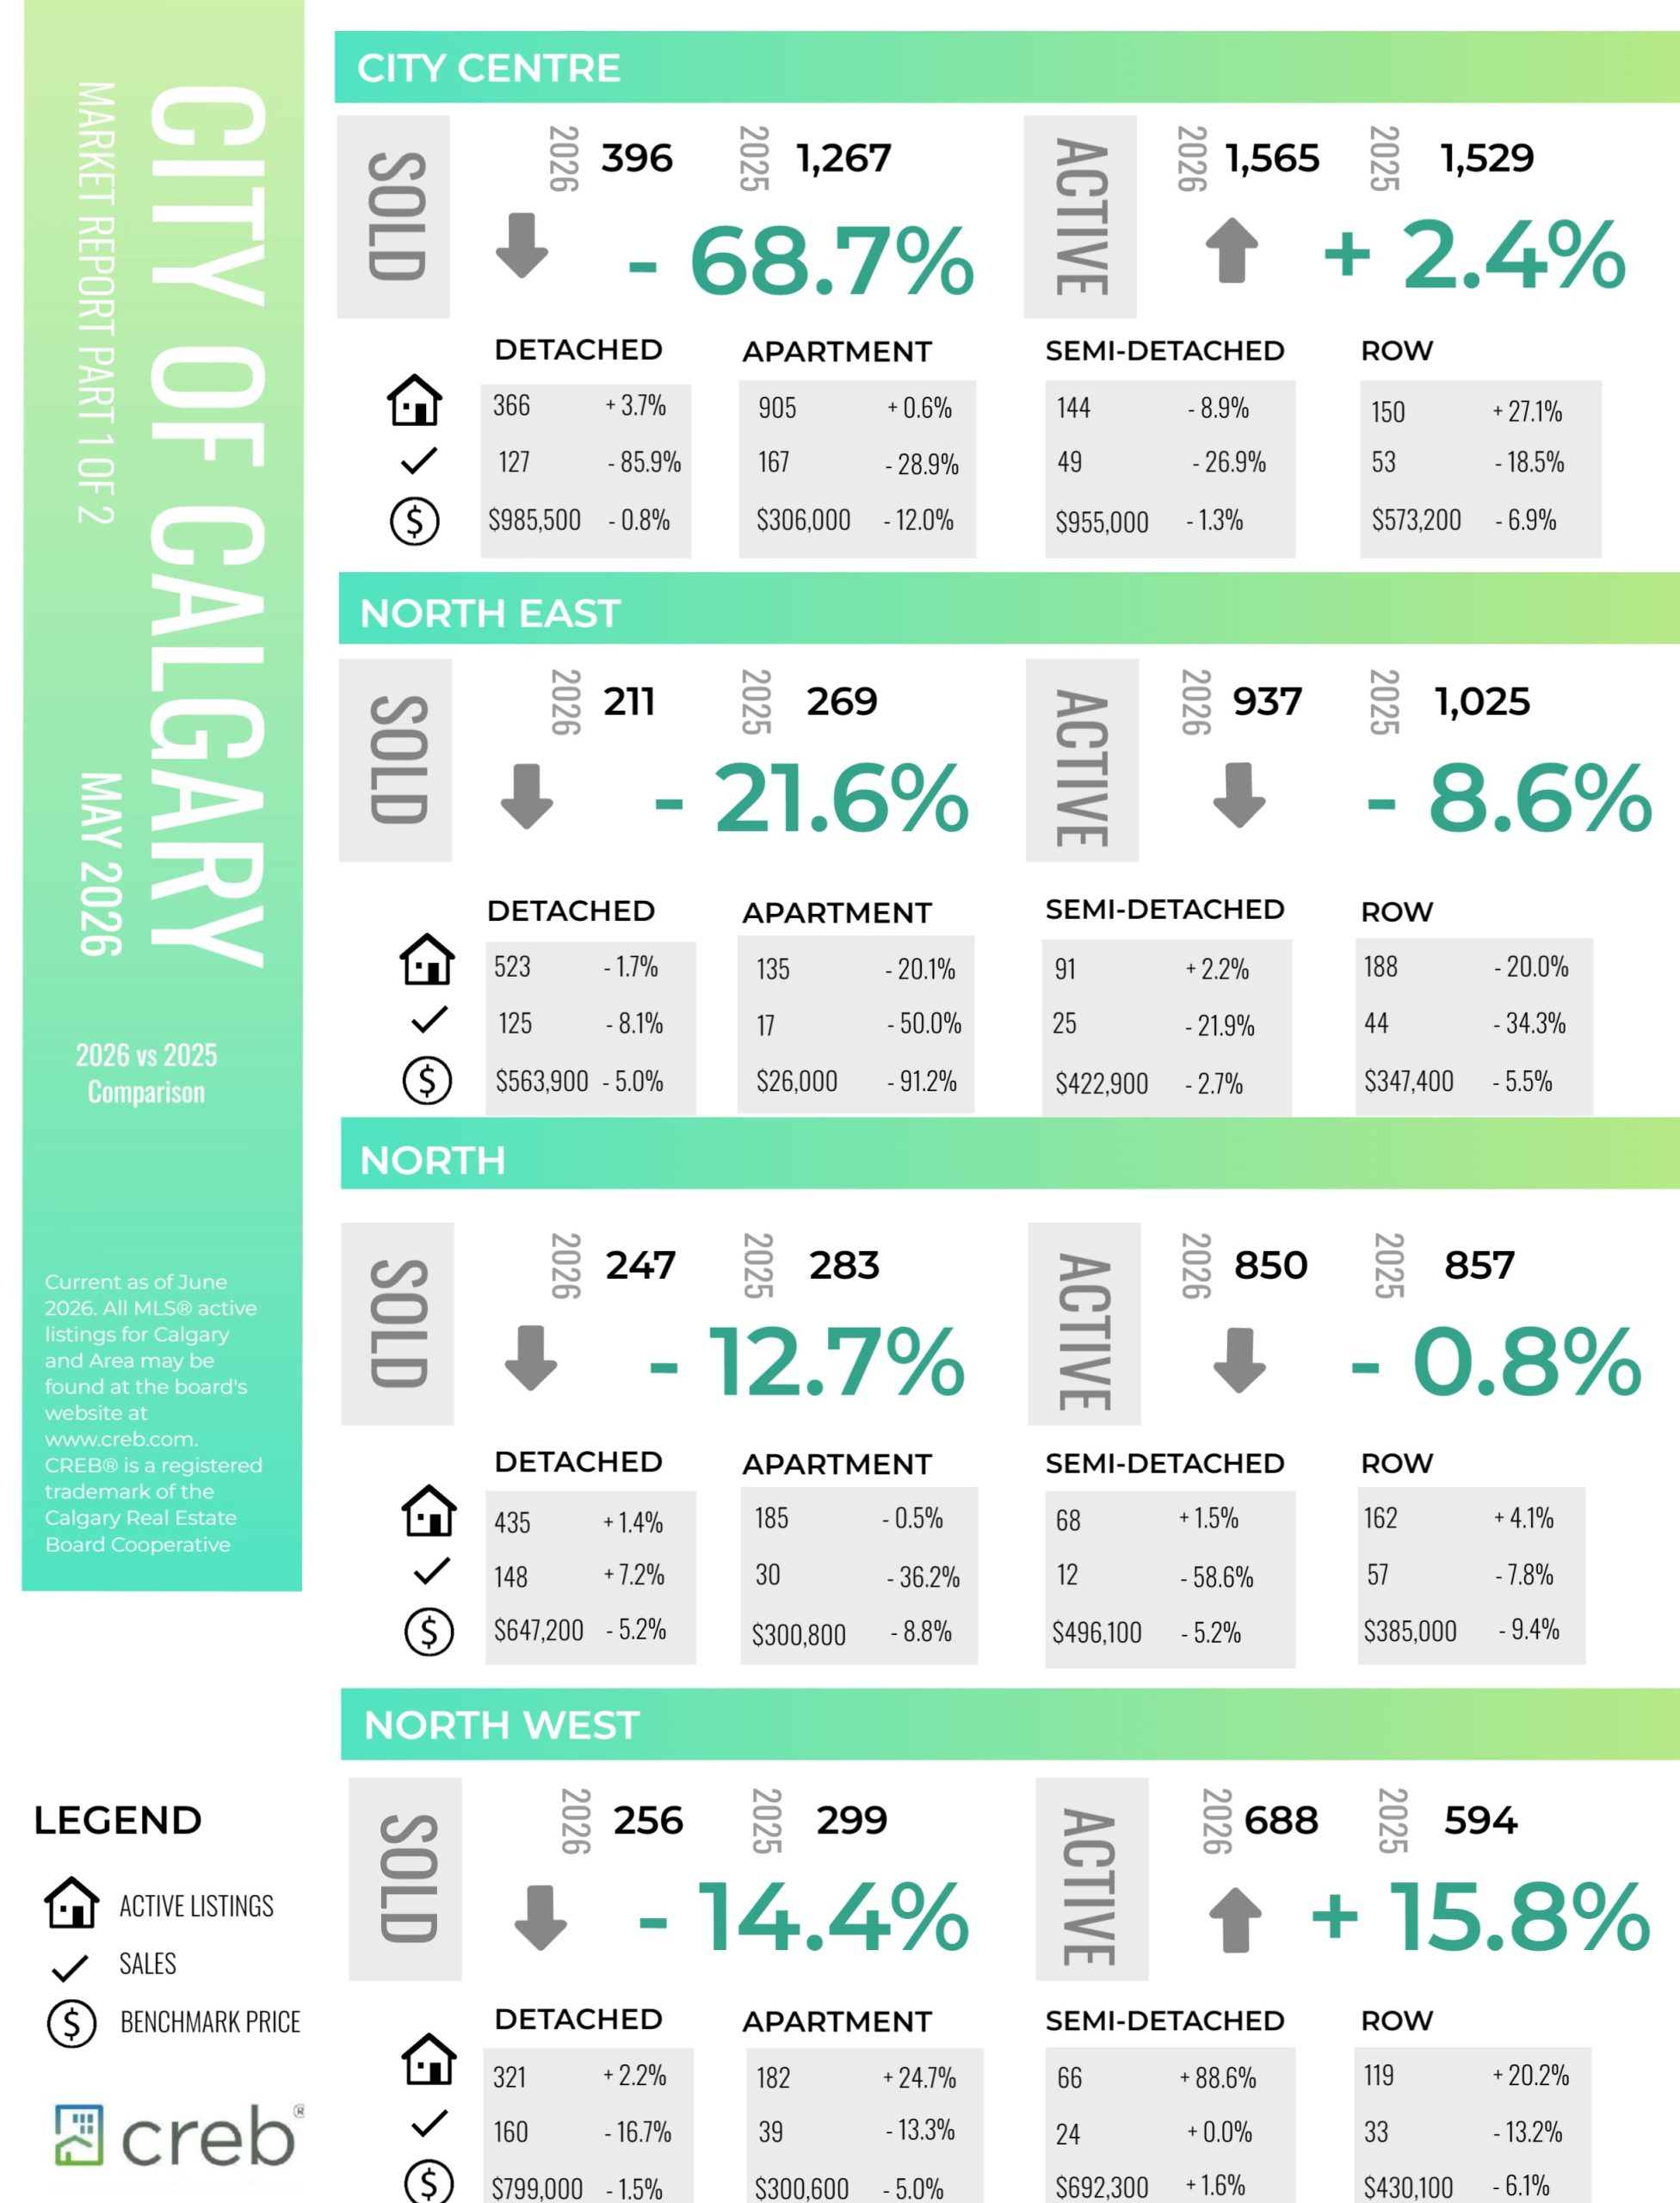
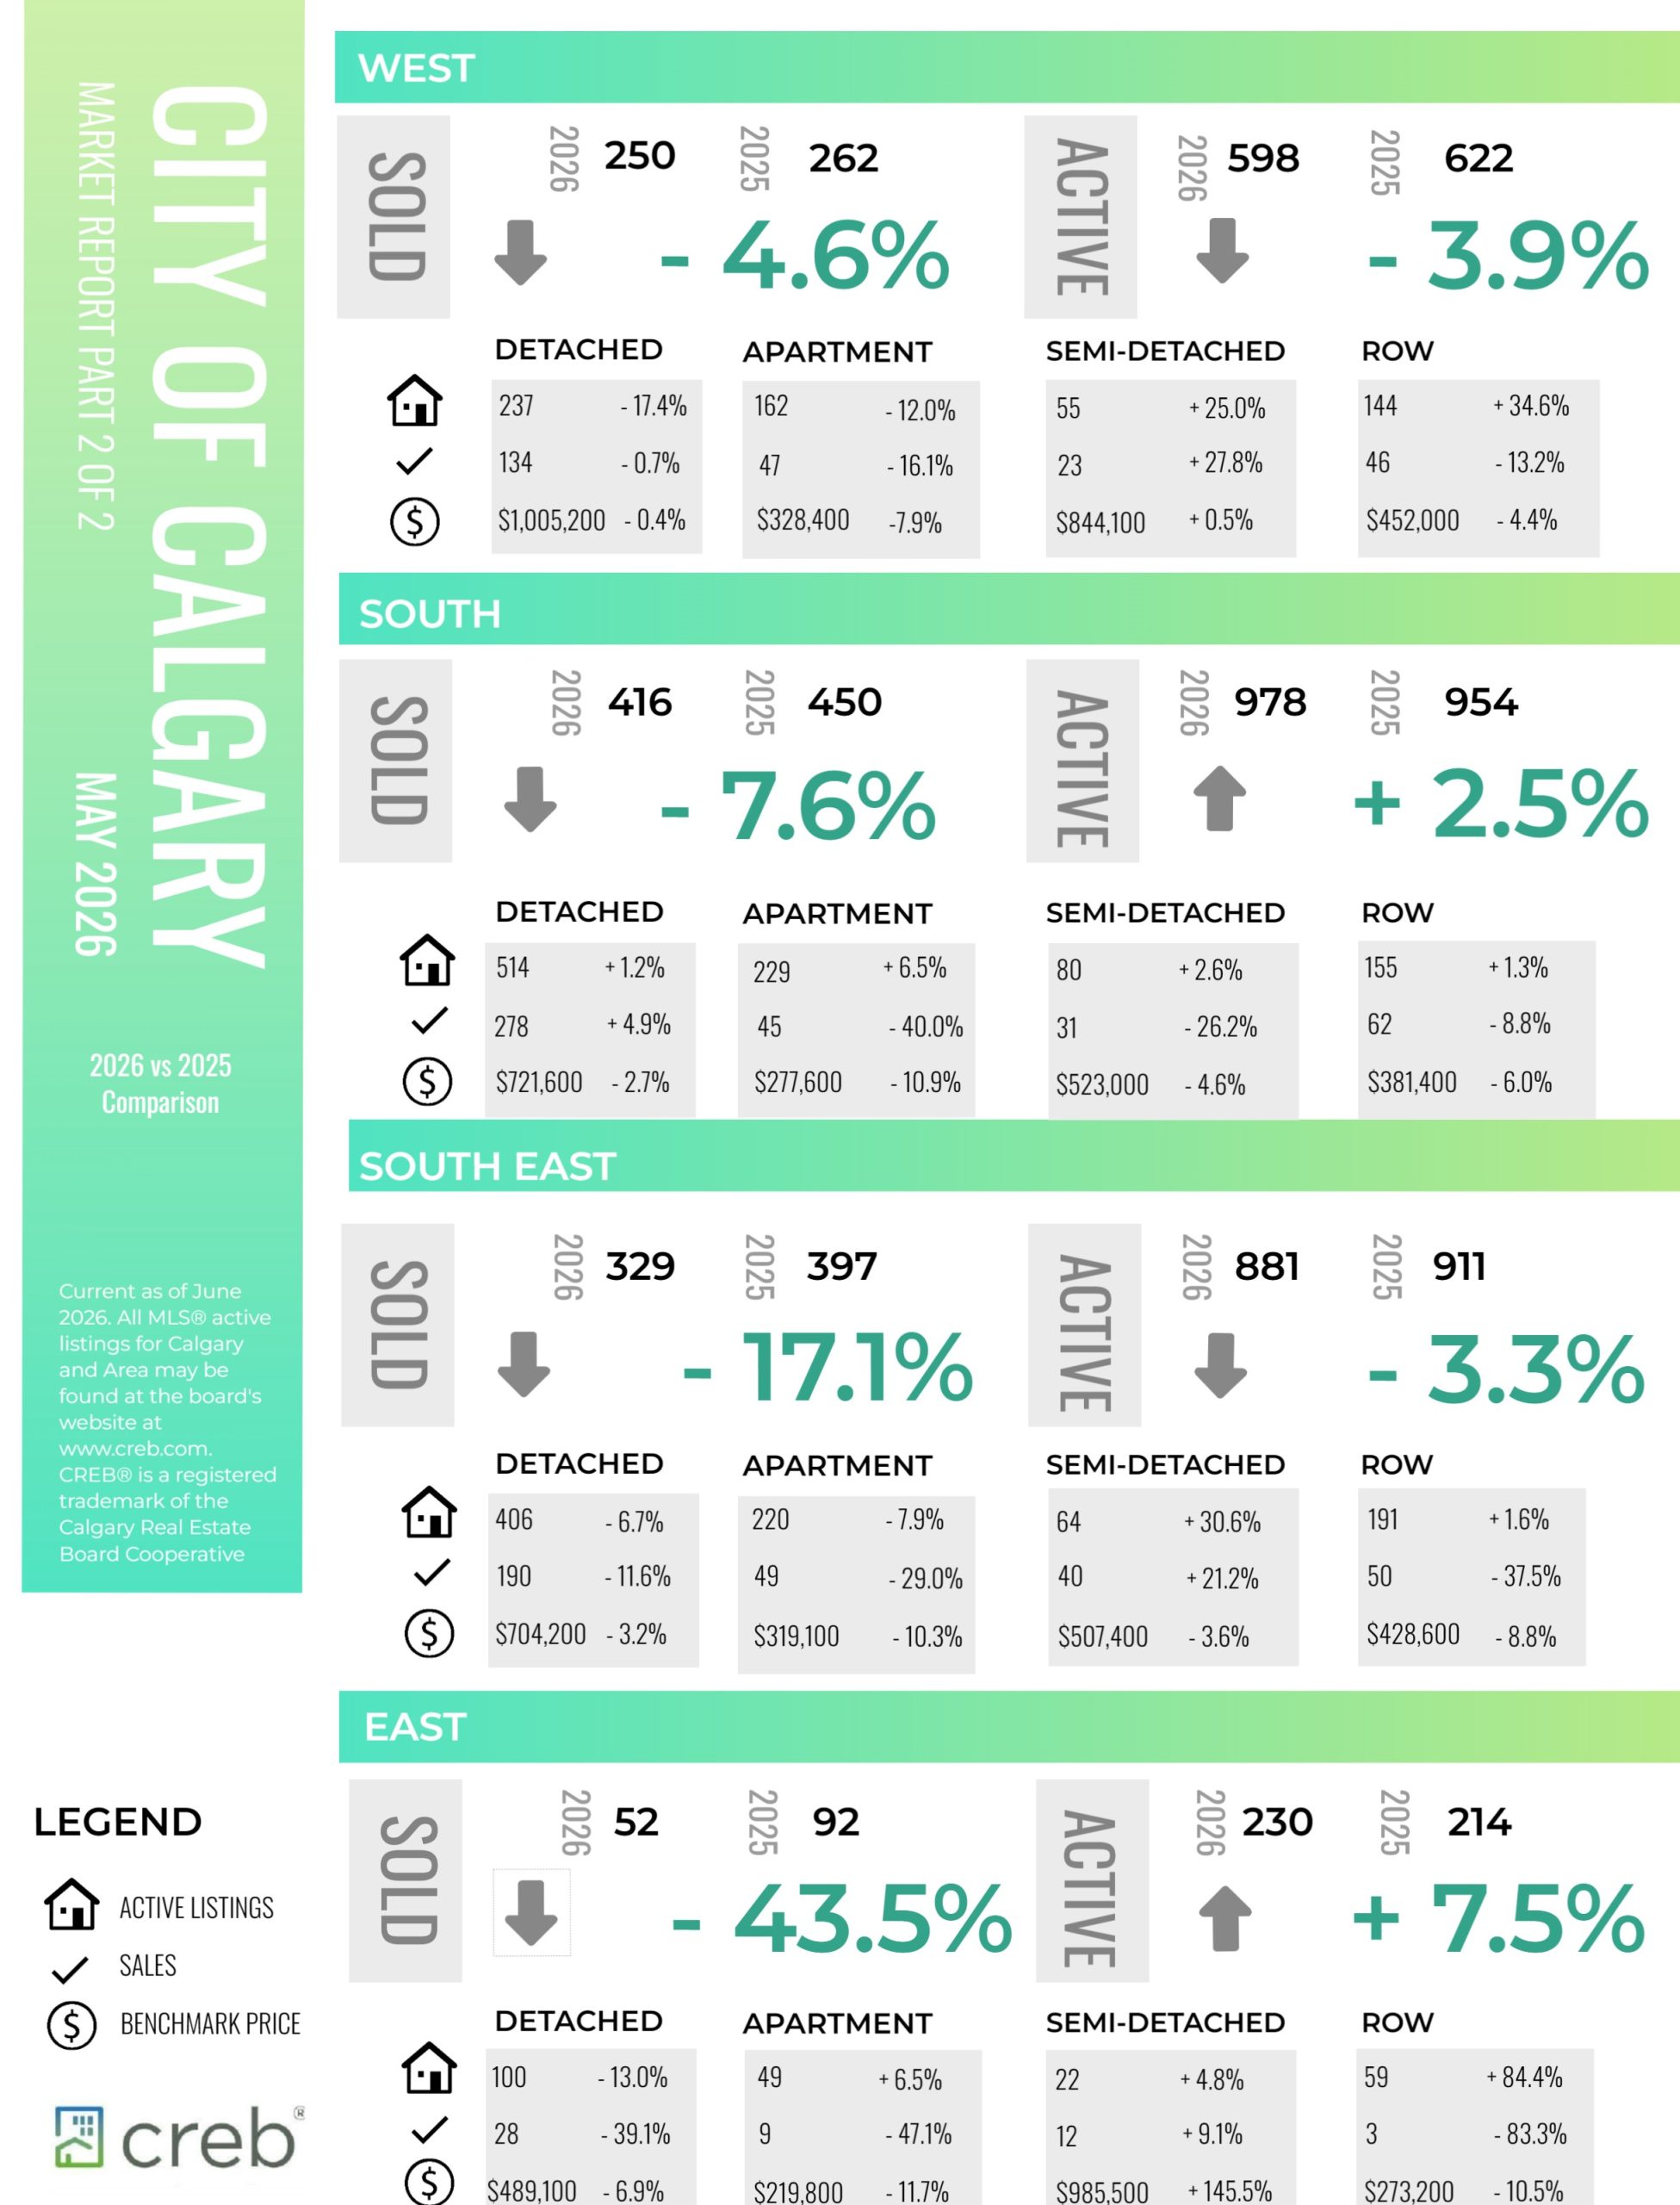
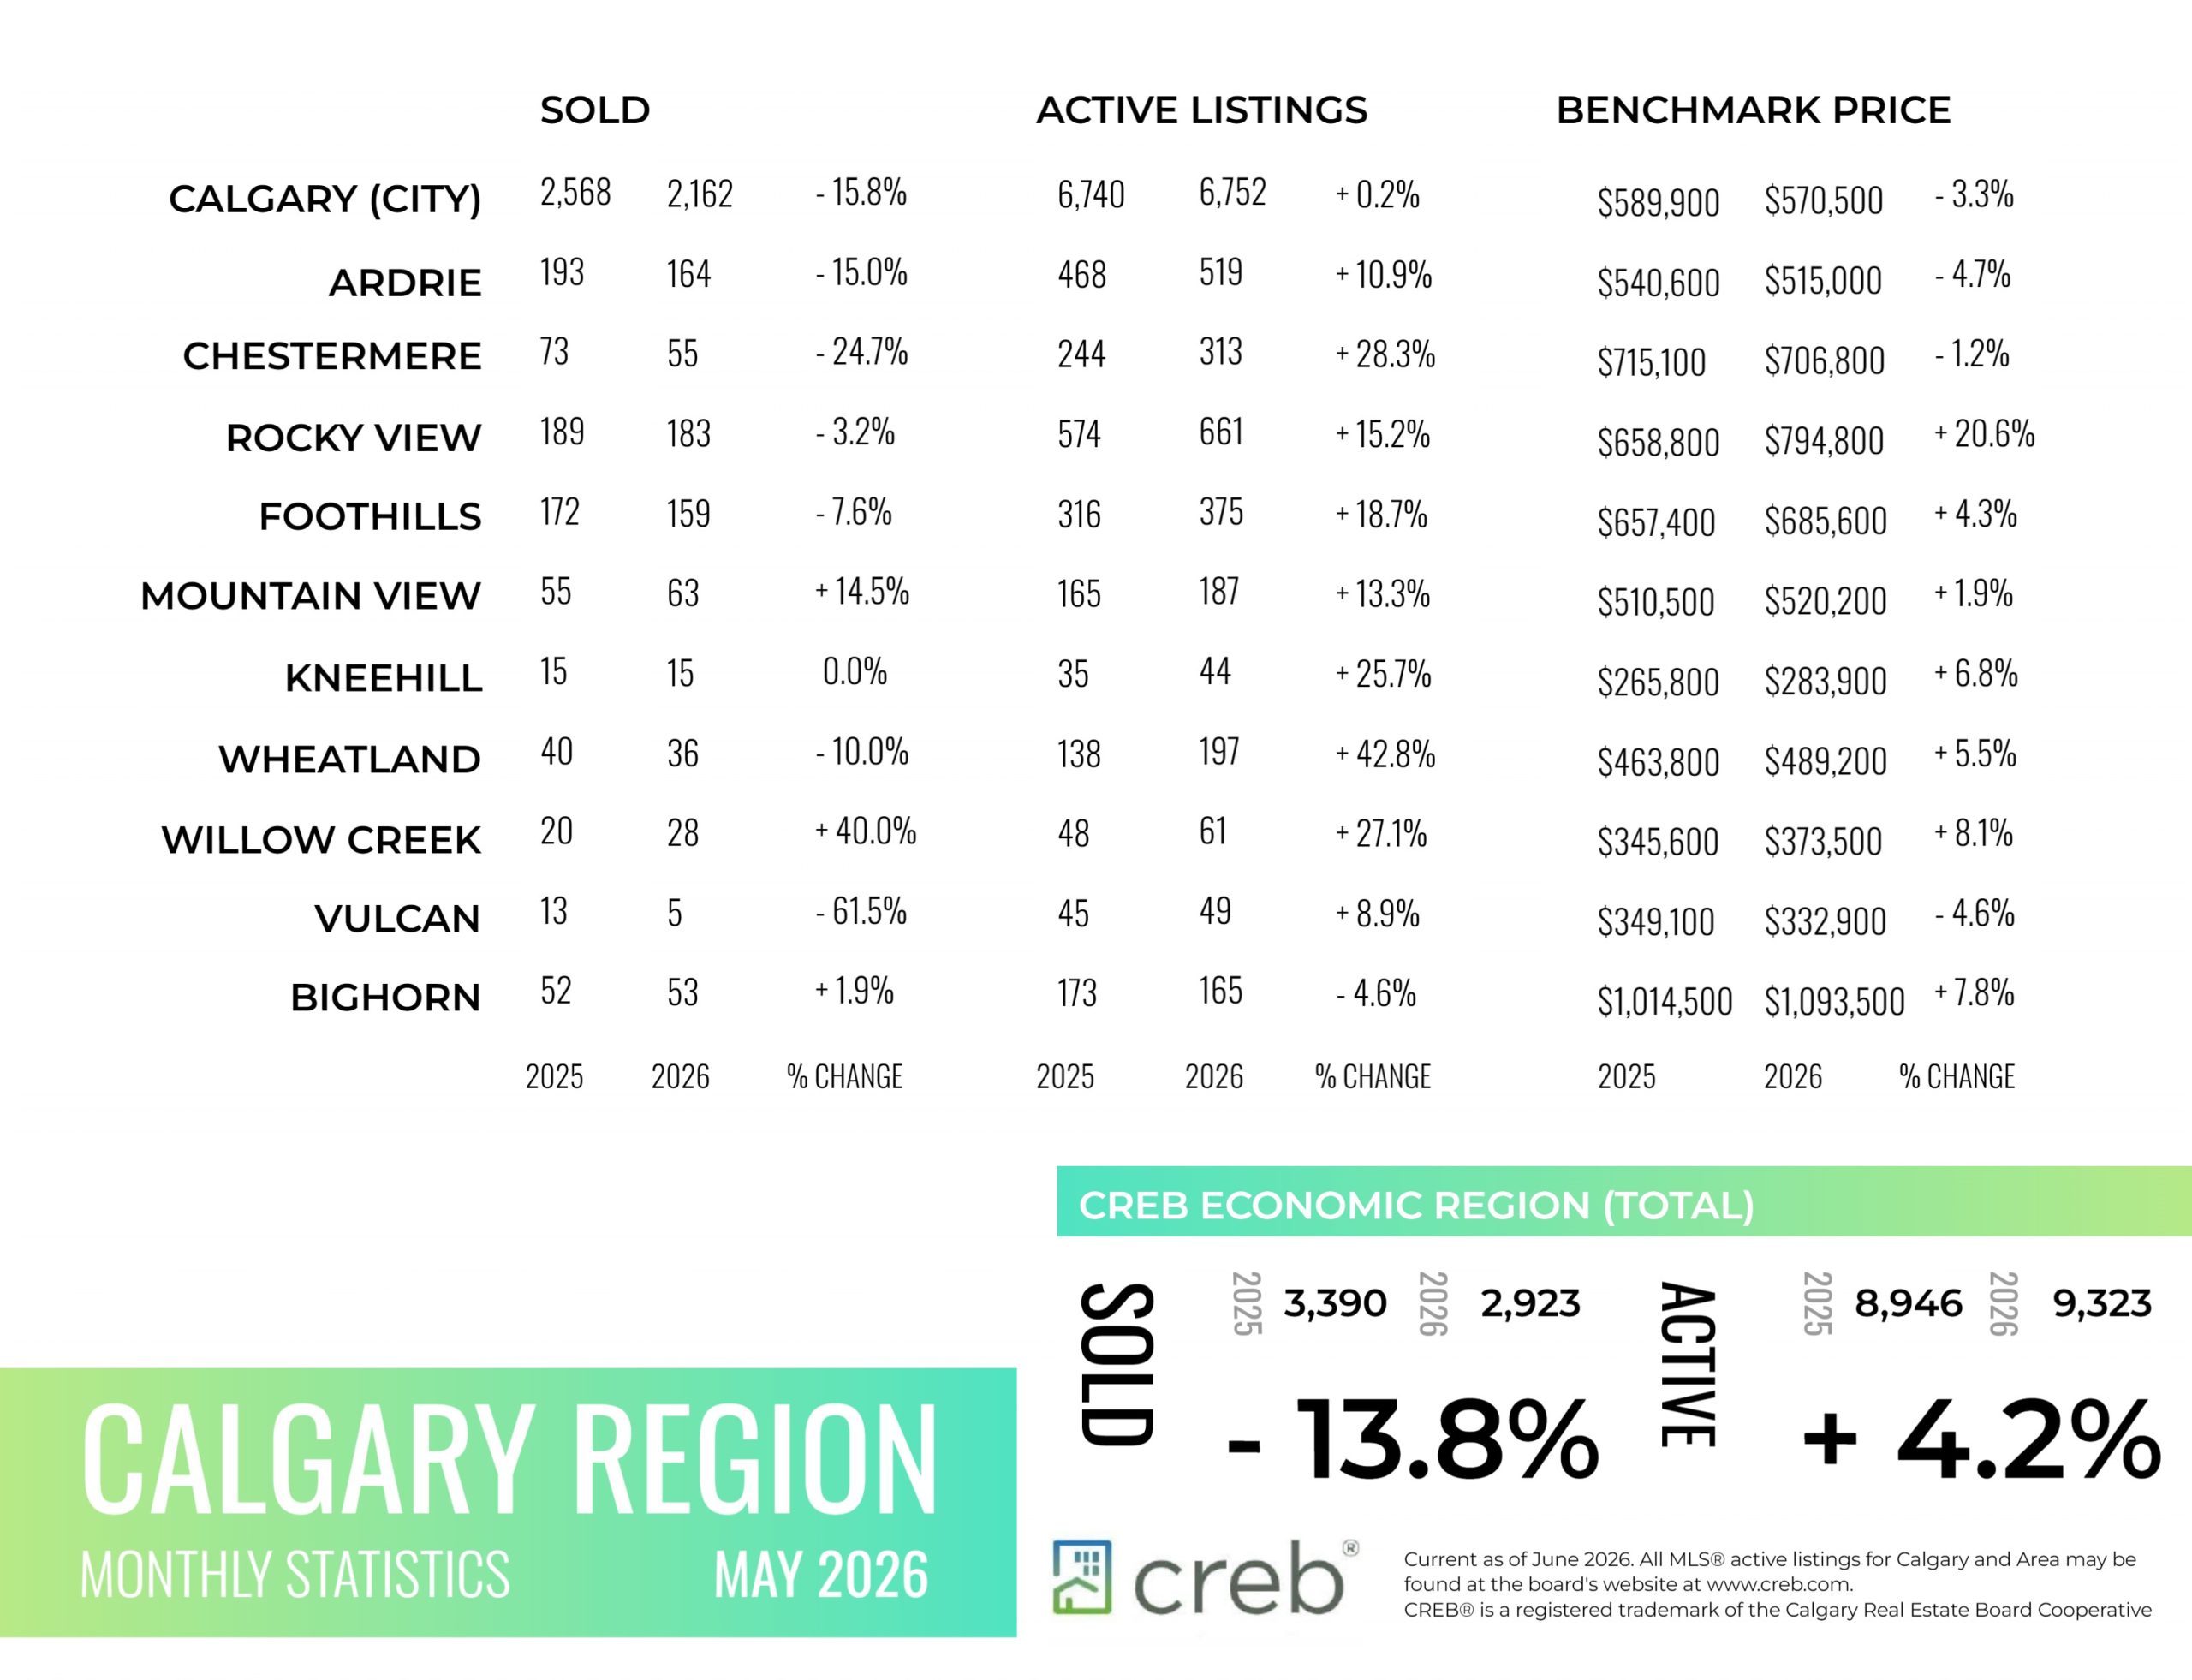
Apartment prices ease as inventory remains elevated
In line with seasonal trends, inventory has risen from the start of the year, reaching 6,752 units in May. While these levels are consistent with last May, they remain 11 per cent higher than longer-term trends for the month, thanks to higher supply levels of apartment and row-style homes. Meanwhile, inventory levels for detached homes are down three per cent compared with both last year and long-term trends.
At the same time, sales activity has been slowing. Calgary sales in May were 2,162 units, 16 per cent lower than last year’s levels and similar to sales reported in April. While new listings also slowed by 13 per cent compared with last year, it was not enough to offset the pullback in sales, causing the salesto-new-listings ratio to ease to 51 per cent. The lower ratio also contributed to some of the inventory build, causing the months of supply to rise. However, conditions do vary across the market, with a range of two-and-a-half months of supply in the detached market to more than five months of supply in the apartment condominium market.
“The shift in supply is being felt in the market. More supply choice in the new and rental markets has created a more competitive environment for potential buyers. At the same time, concerns over rising cost of living and slower migration are also weighing on consumers,” said Ann-Marie Lurie, Chief Economist at the Calgary Real Estate Board (CREB®). “While this has caused the overall resale market to shift to a balanced state, the supply pressure is having a more prevalent impact for apartment-style units, where conditions are favouring the buyer. This is also impacting price movements, with apartment prices continuing to trend down and other property types reporting a seasonal lift over the winter months.”
Read the full report on the CREB website!
The following data is a comparison between May 2026 and May 2025 numbers, and is current as of June 0f 2026. For last month’s numbers, check out our previous infographic.
Or follow this link for all our CREB Infographics!
Click on the images for a larger view!
Download Printable Version – May 2026 CREB, City of Calgary Report Pages 1 and 2
Download Printable Version – May 2026 CREB, Calgary Region Report
INFOGRAPHICS: April 2026 CREB City And Region Market Reports
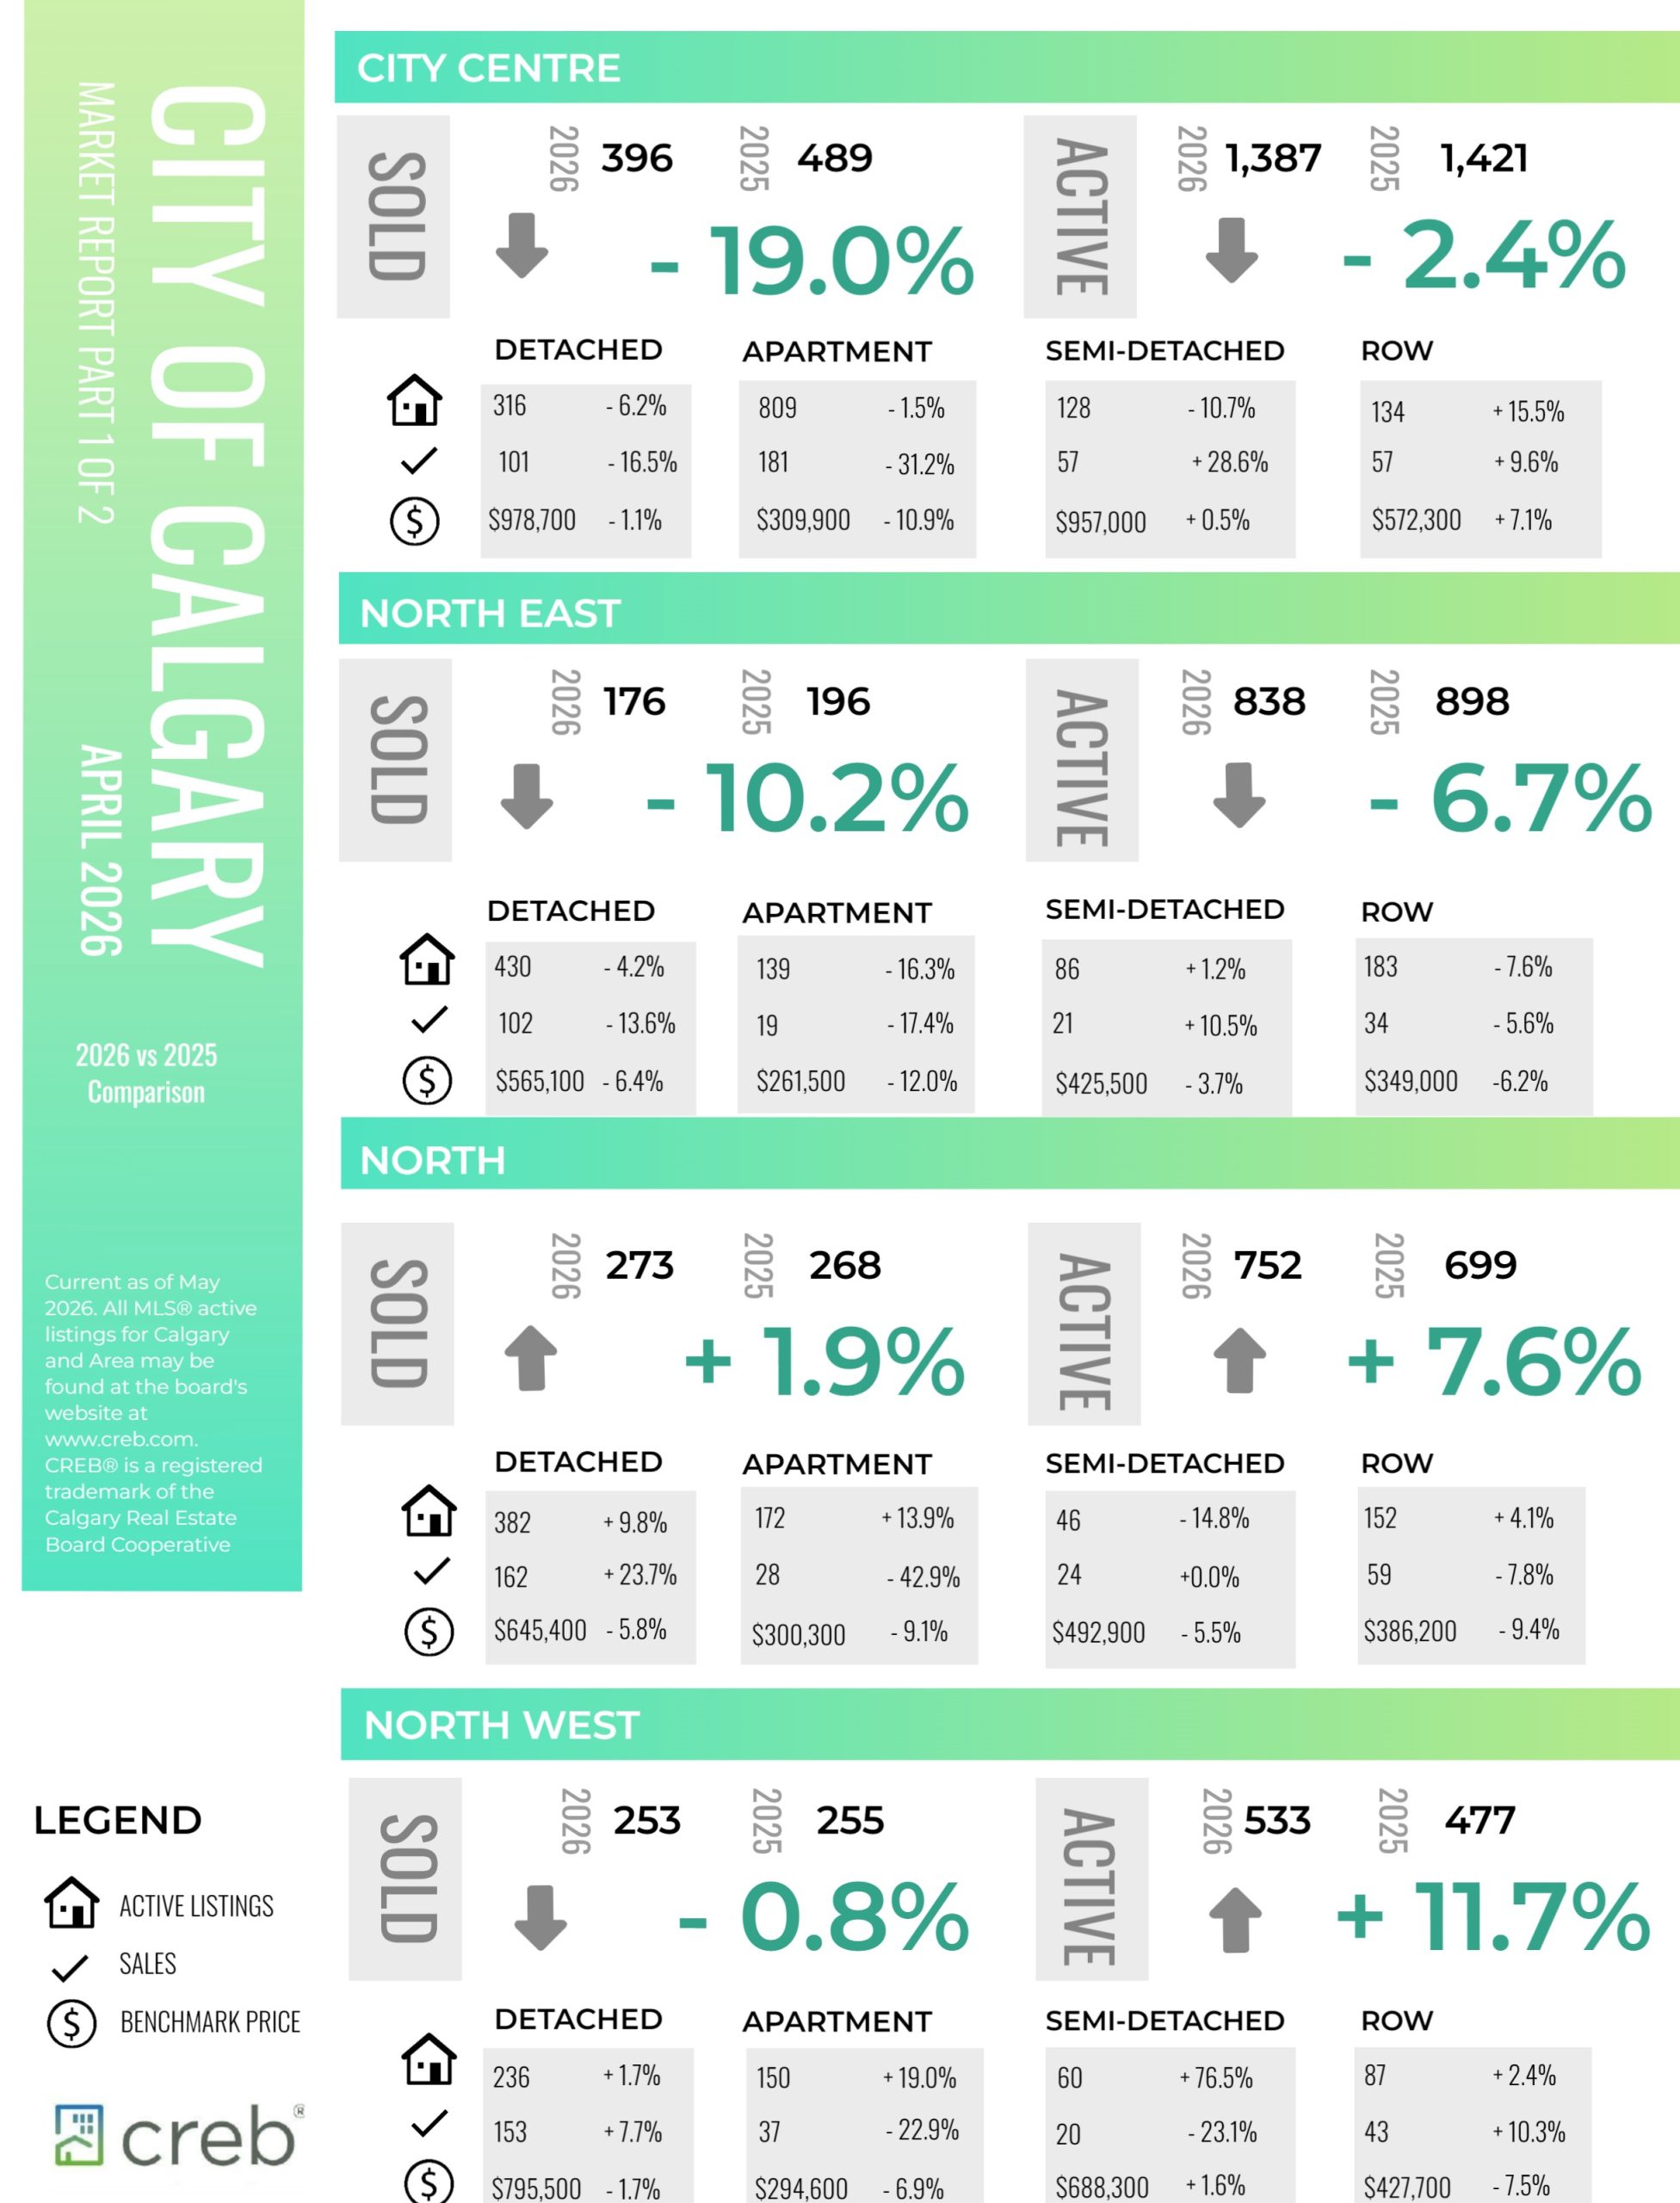
Balanced conditions in the city, except for apartment-style units
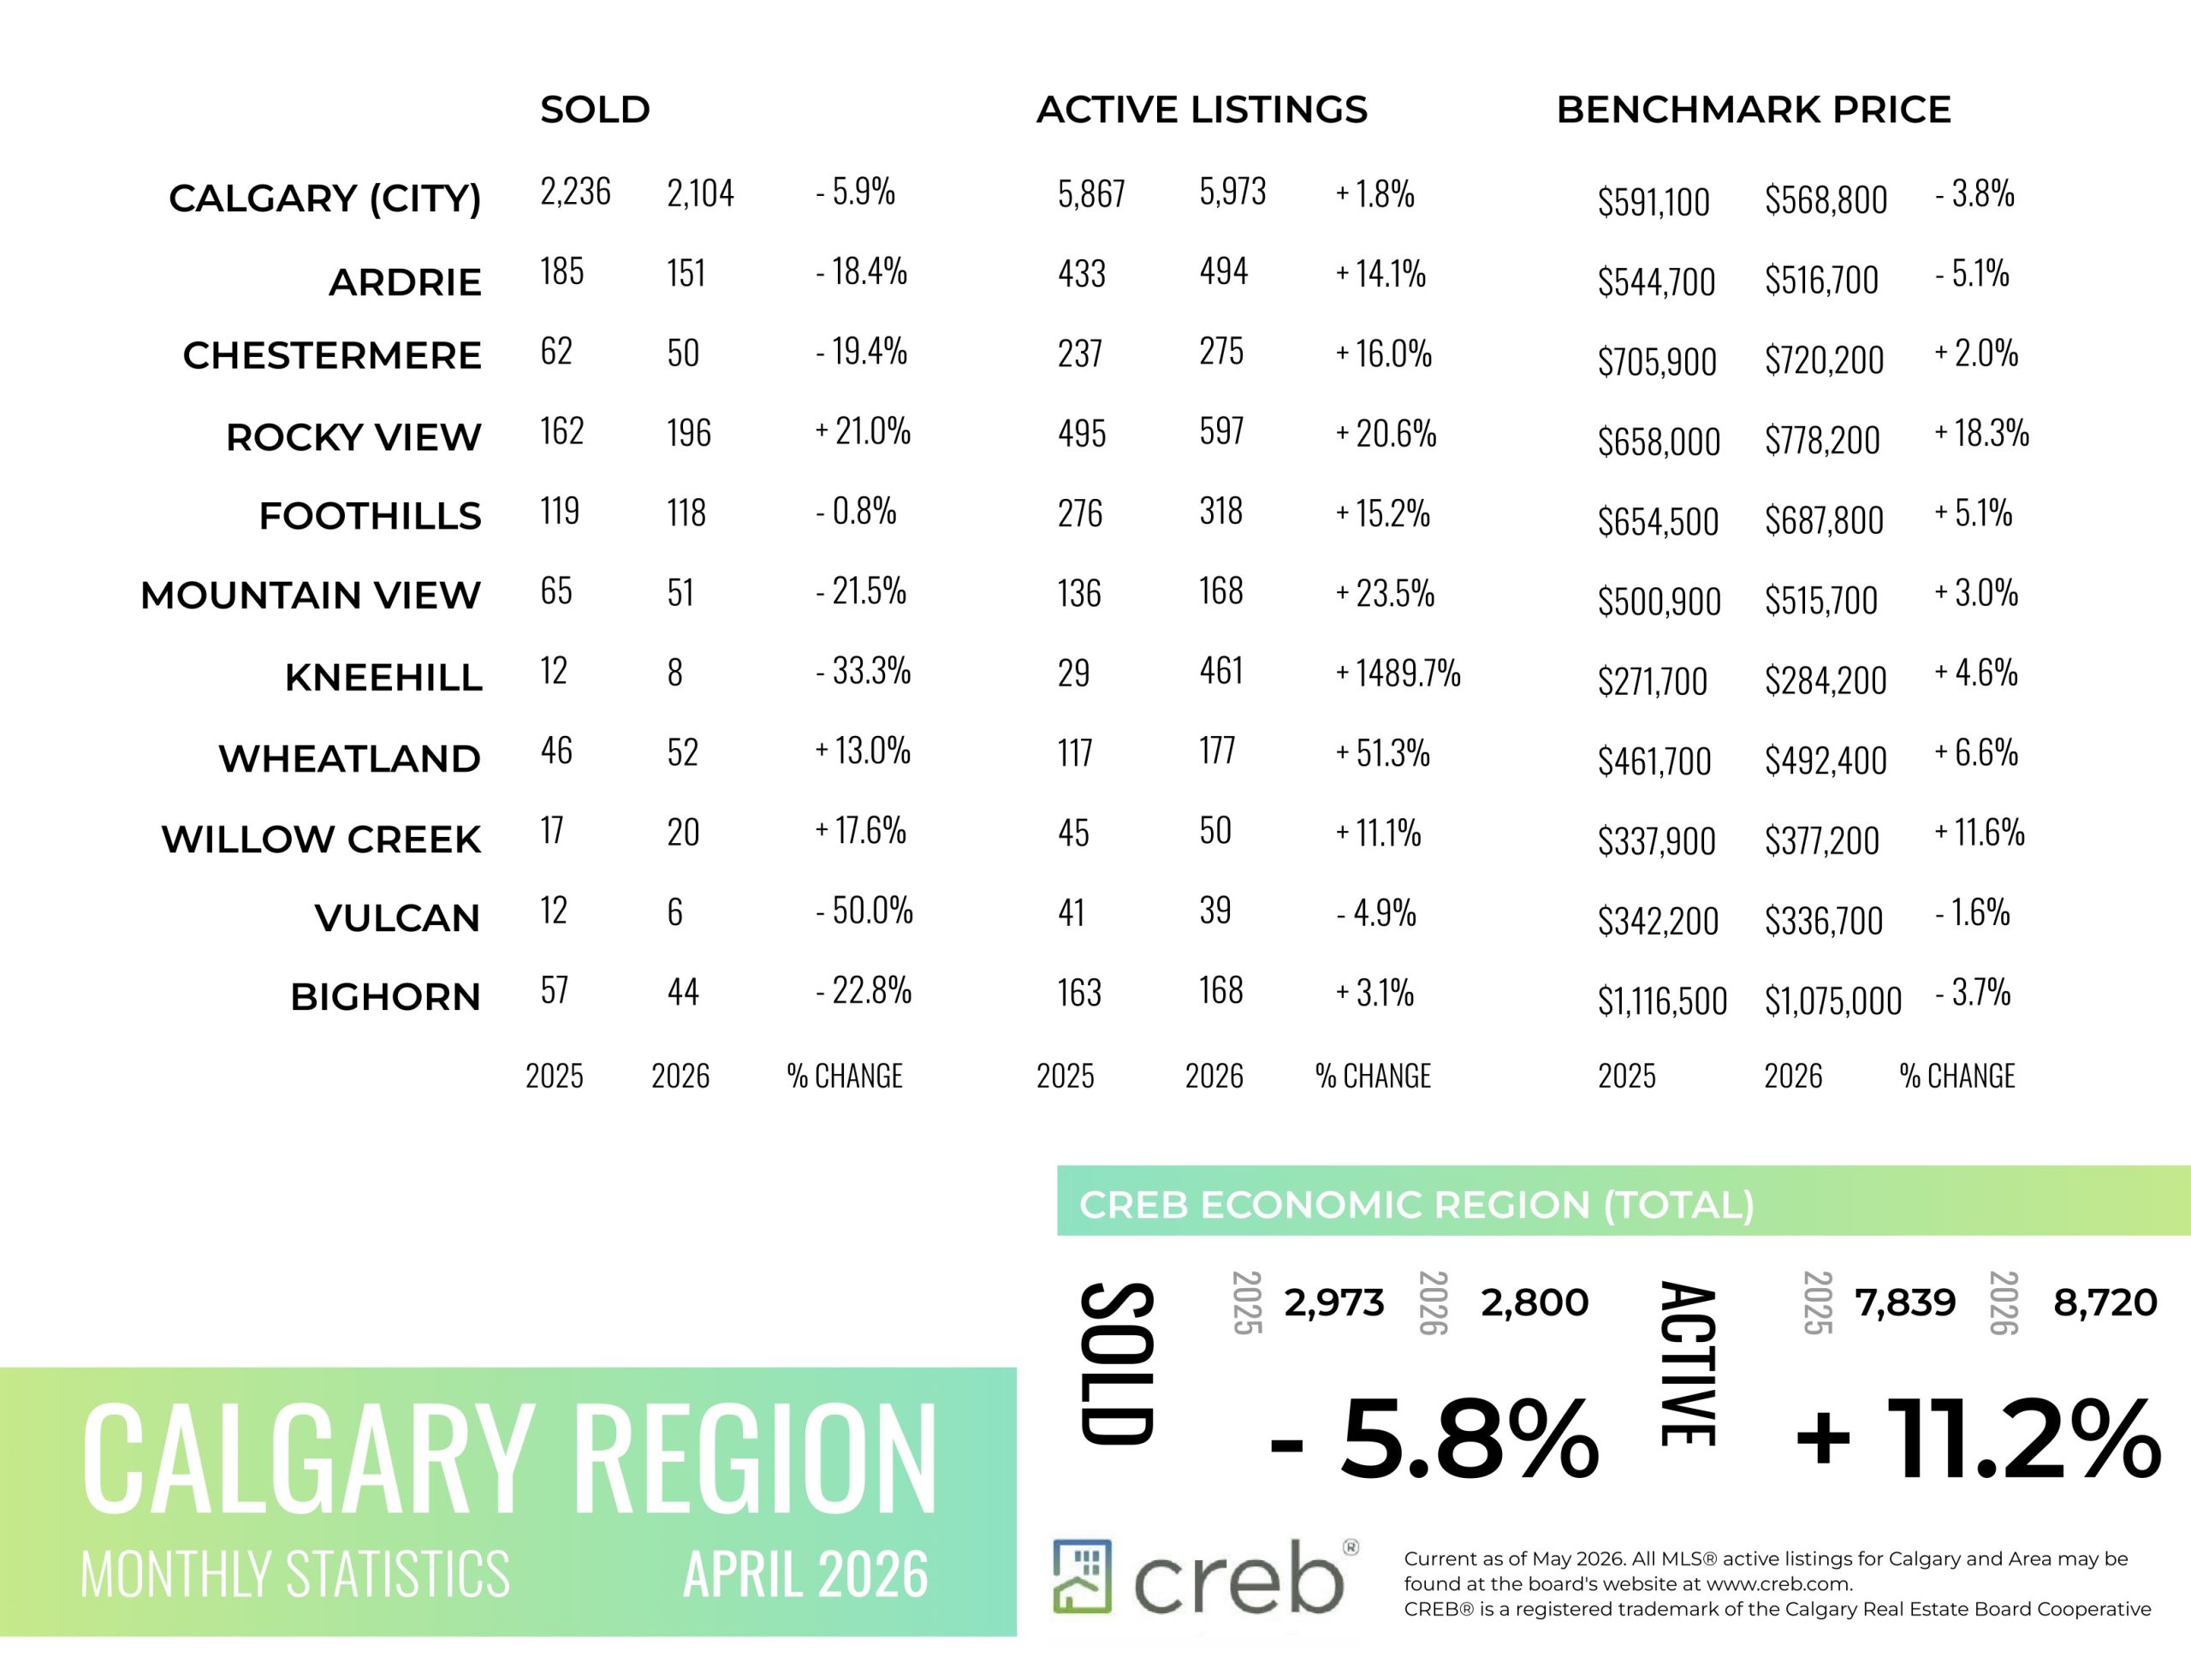
In line with seasonal expectations, both sales and inventory levels trended up relative to March’s activity. Despite this typical monthly rise, April sales totalled 2,104 units, six per cent lower than levels reported in 2025.
“Sales were expected to ease this year as our market transitioned away from strong demand that was driven by previously rapid migration growth. Improved supply choice across the entire housing spectrum has reduced the urgency among potential purchasers, helping our market shift away from seller’s market conditions to more balanced conditions,” said Ann-Marie Lurie, CREB®’s Chief Economist. “However, the trend of limited supply choice in the detached market continues, while conditions favour the buyer in the apartment condominium market.”
With 3,829 new listings in April, the sales-to-new-listings ratio remained at 55 per cent, supporting a modest monthly gain in supply. Inventory levels reached 5,973 units, nearly two per cent higher than levels reported last April. Overall, the months of supply remained just below three, representing relatively balanced conditions. However, this ranged from just over two months for detached homes to over four months for apartment-style homes.
The unadjusted total residential benchmark price trended up compared with March, reaching $568,800. The monthly gain was mostly associated with seasonal improvements, which is expected heading into the spring market. Monthly gains were higher in the detached and semi-detached segments. Overall, compared with the previous year, prices
remain three per cent lower, with modest year-over-year declines in the detached and semi-detached sector, while declines neared nine per cent for apartment-style units.
So far in 2026, conditions have varied, ranging from seller’s market conditions and price growth for detached homes in some parts of the city to buyer’s market conditions and price adjustments in the apartment condominium sector.
Read the full report on the CREB website!
The following data is a comparison between April 2026 and April 2025 numbers, and is current as of May 0f 2026. For last month’s numbers, check out our previous infographic.
Or follow this link for all our CREB Infographics!
Click on the images for a larger view!
Download Printable Version – April 2026 CREB, City of Calgary Report Pages 1 and 2
Download Printable Version – April 2026 CREB, Calgary Region Report

INFOGRAPHICS: March 2026 CREB City And Region Market Reports
Trends differ based on property type
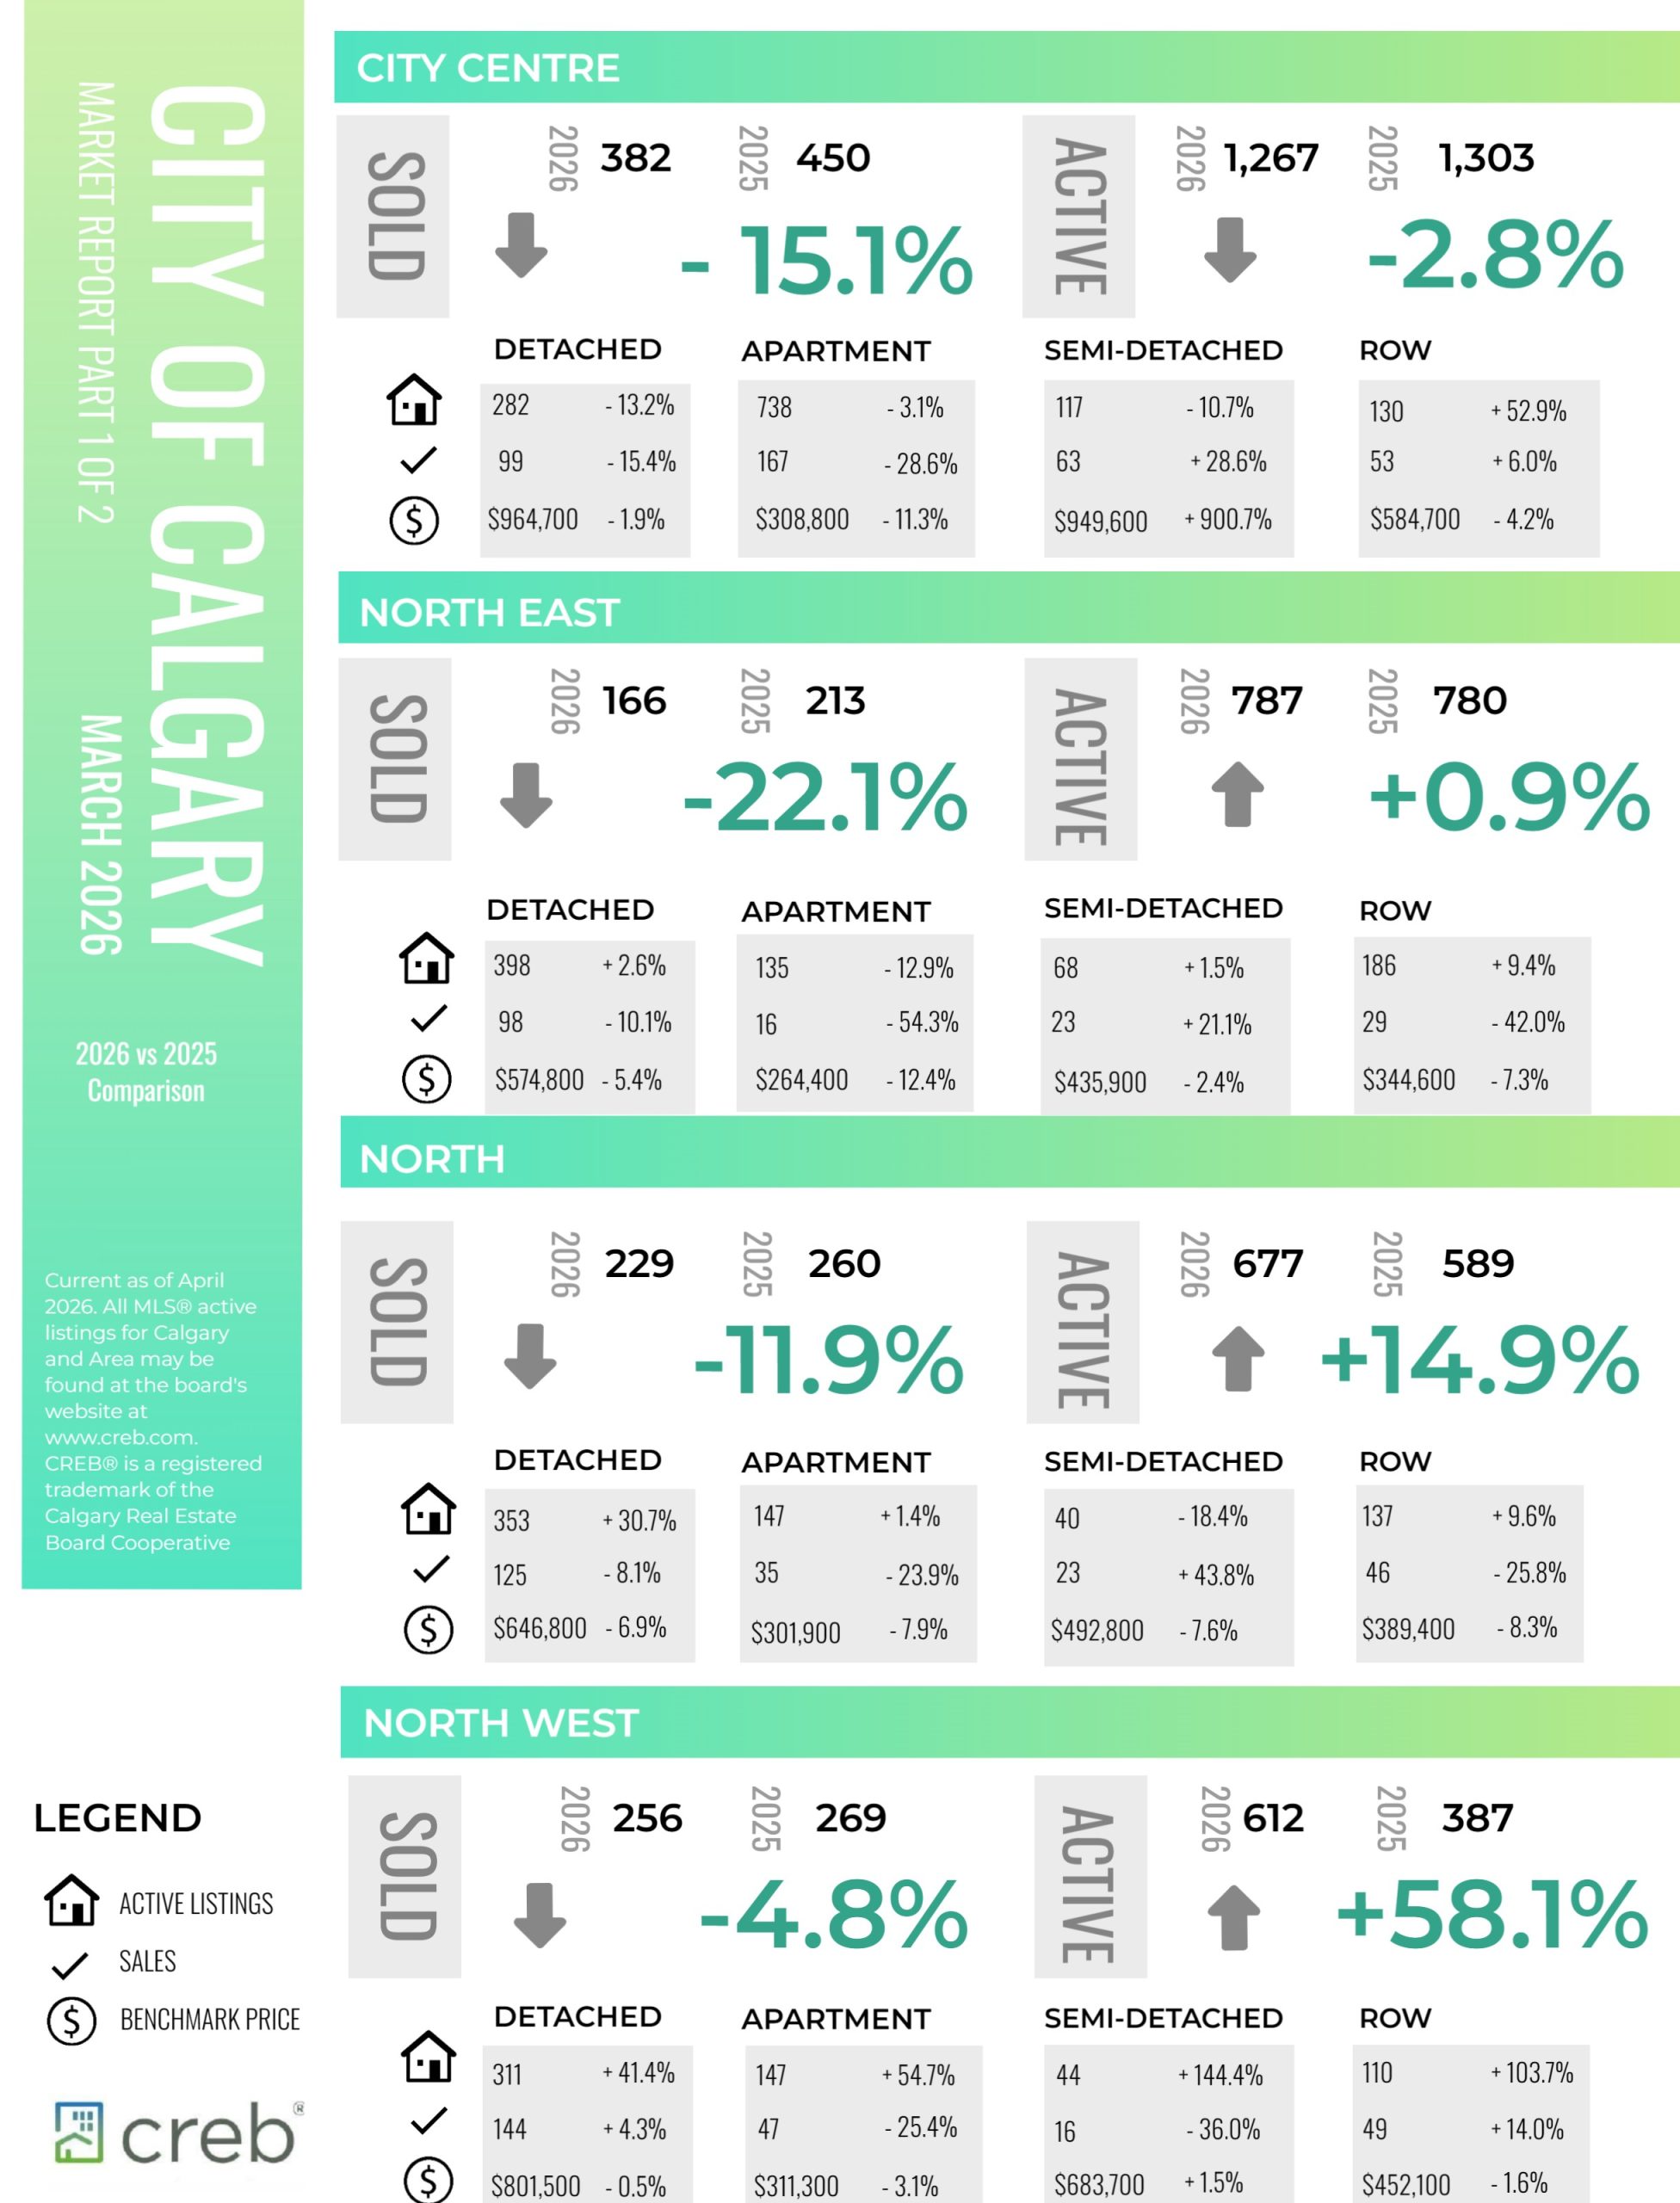
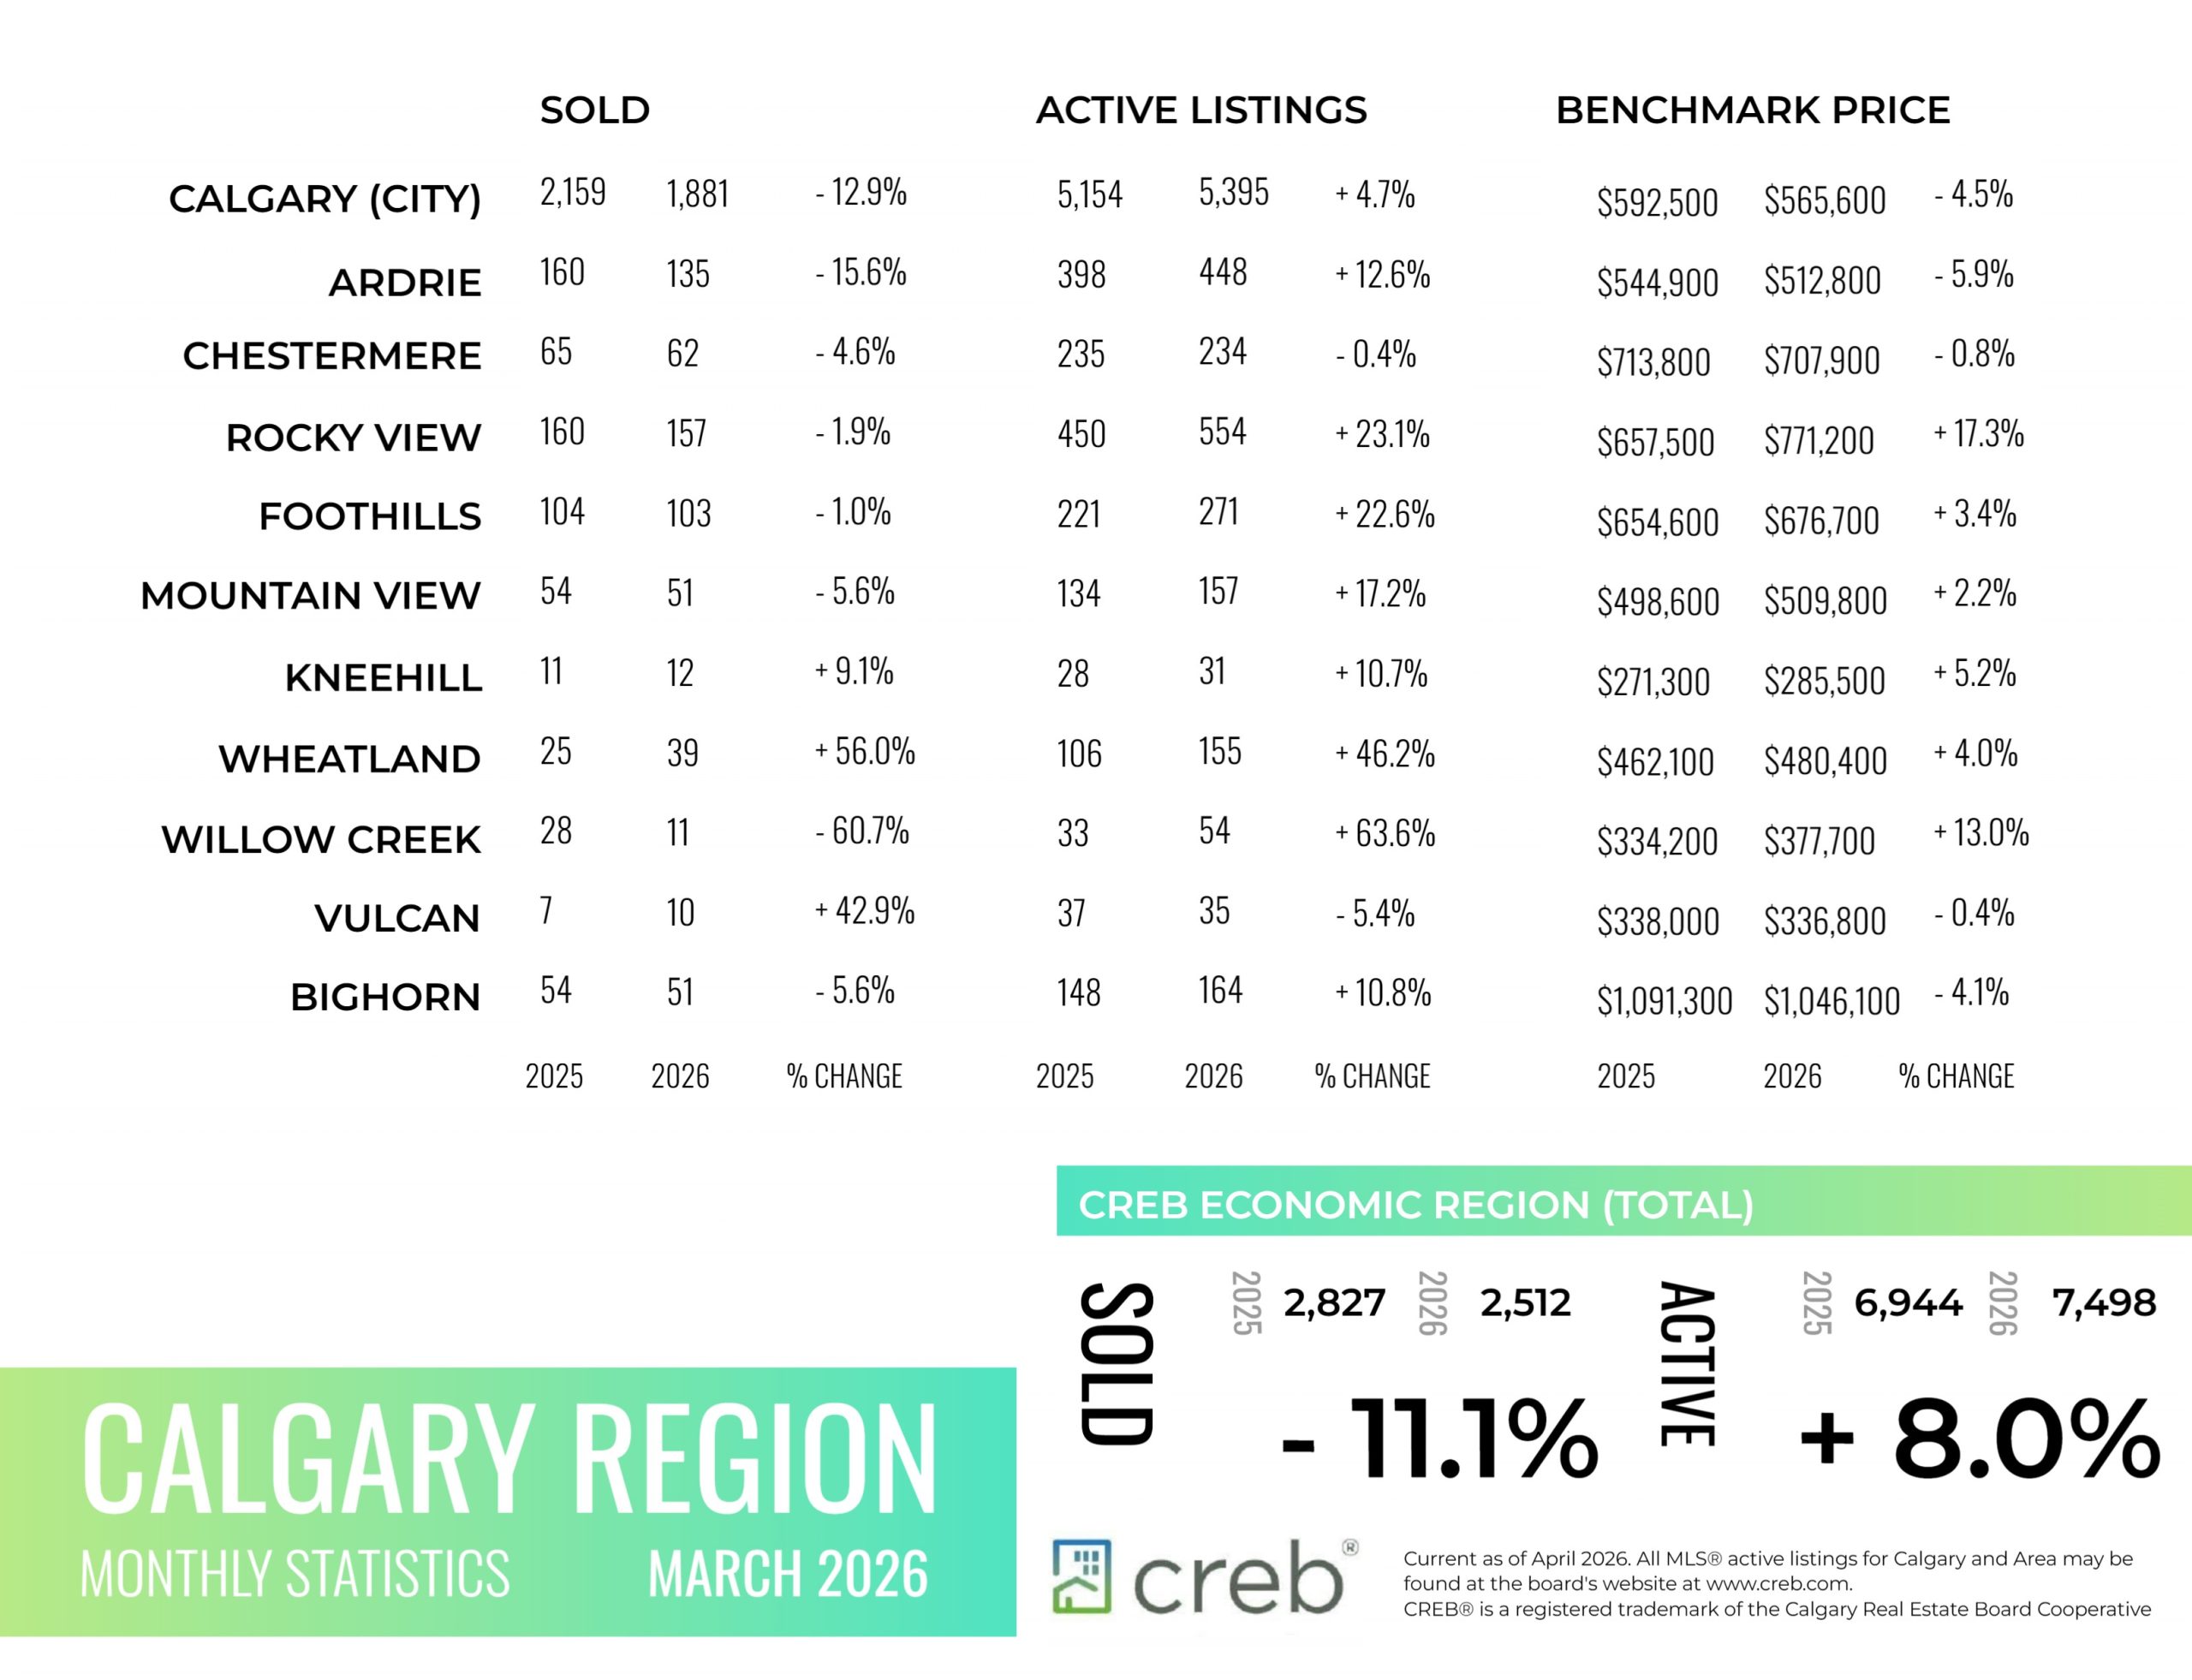
Supply conditions in March varied significantly depending on property type. Inventory levels saw a typical monthly rise, but compared with long-term trends, inventory remained well above the 10-year average for both row and apartment-style units and well below trend for detached homes. This is not a surprise given the pullback in detached housing starts last year despite record-high apartment-style starts.
There were 1,881 sales in March, up from the previous month, but still 13 per cent lower than levels reported last year and below long-term trends for March. The decline in sales is mostly due to pullbacks in apartment-style activity, where increased supply choice and slower migration is spreading demand across a wider range of supply. Meanwhile, detached sales have also slowed compared to long-term trends, likely due to limited supply choice in some city districts.
“When considering total residential housing statistics, conditions appear to be relatively balanced as sales, new listings, inventories and prices all trended up over the previous month as we start to move into the spring market,” said Ann-Marie Lurie, CREB®’s Chief Economist. “However, when we look deeper, we are seeing a market that ranges from tighter conditions for detached homes to the apartment sector, where conditions tend to favour the buyer. As expected, this is supporting upward momentum in detached prices and downward pressure in the apartment condominium sector.”
The total unadjusted benchmark price in the city was $565,600, up nearly one per cent compared to February but down by more than four per cent compared to last year. After the first quarter, benchmark prices posted modest to stable conditions for lower density homes. However, apartment condominium prices continued to slide, dropping another three per cent in the first quarter compared to the fourth quarter of last year.
Read the full report on the CREB website!
The following data is a comparison between March 2026 and March 2025 numbers, and is current as of April 0f 2026. For last month’s numbers, check out our previous infographic.
Or follow this link for all our CREB Infographics!
Click on the images for a larger view!
Download Printable Version – March 2026 CREB, City of Calgary Report Pages 1 and 2
Download Printable Version – March 2026 CREB, Calgary Region Report
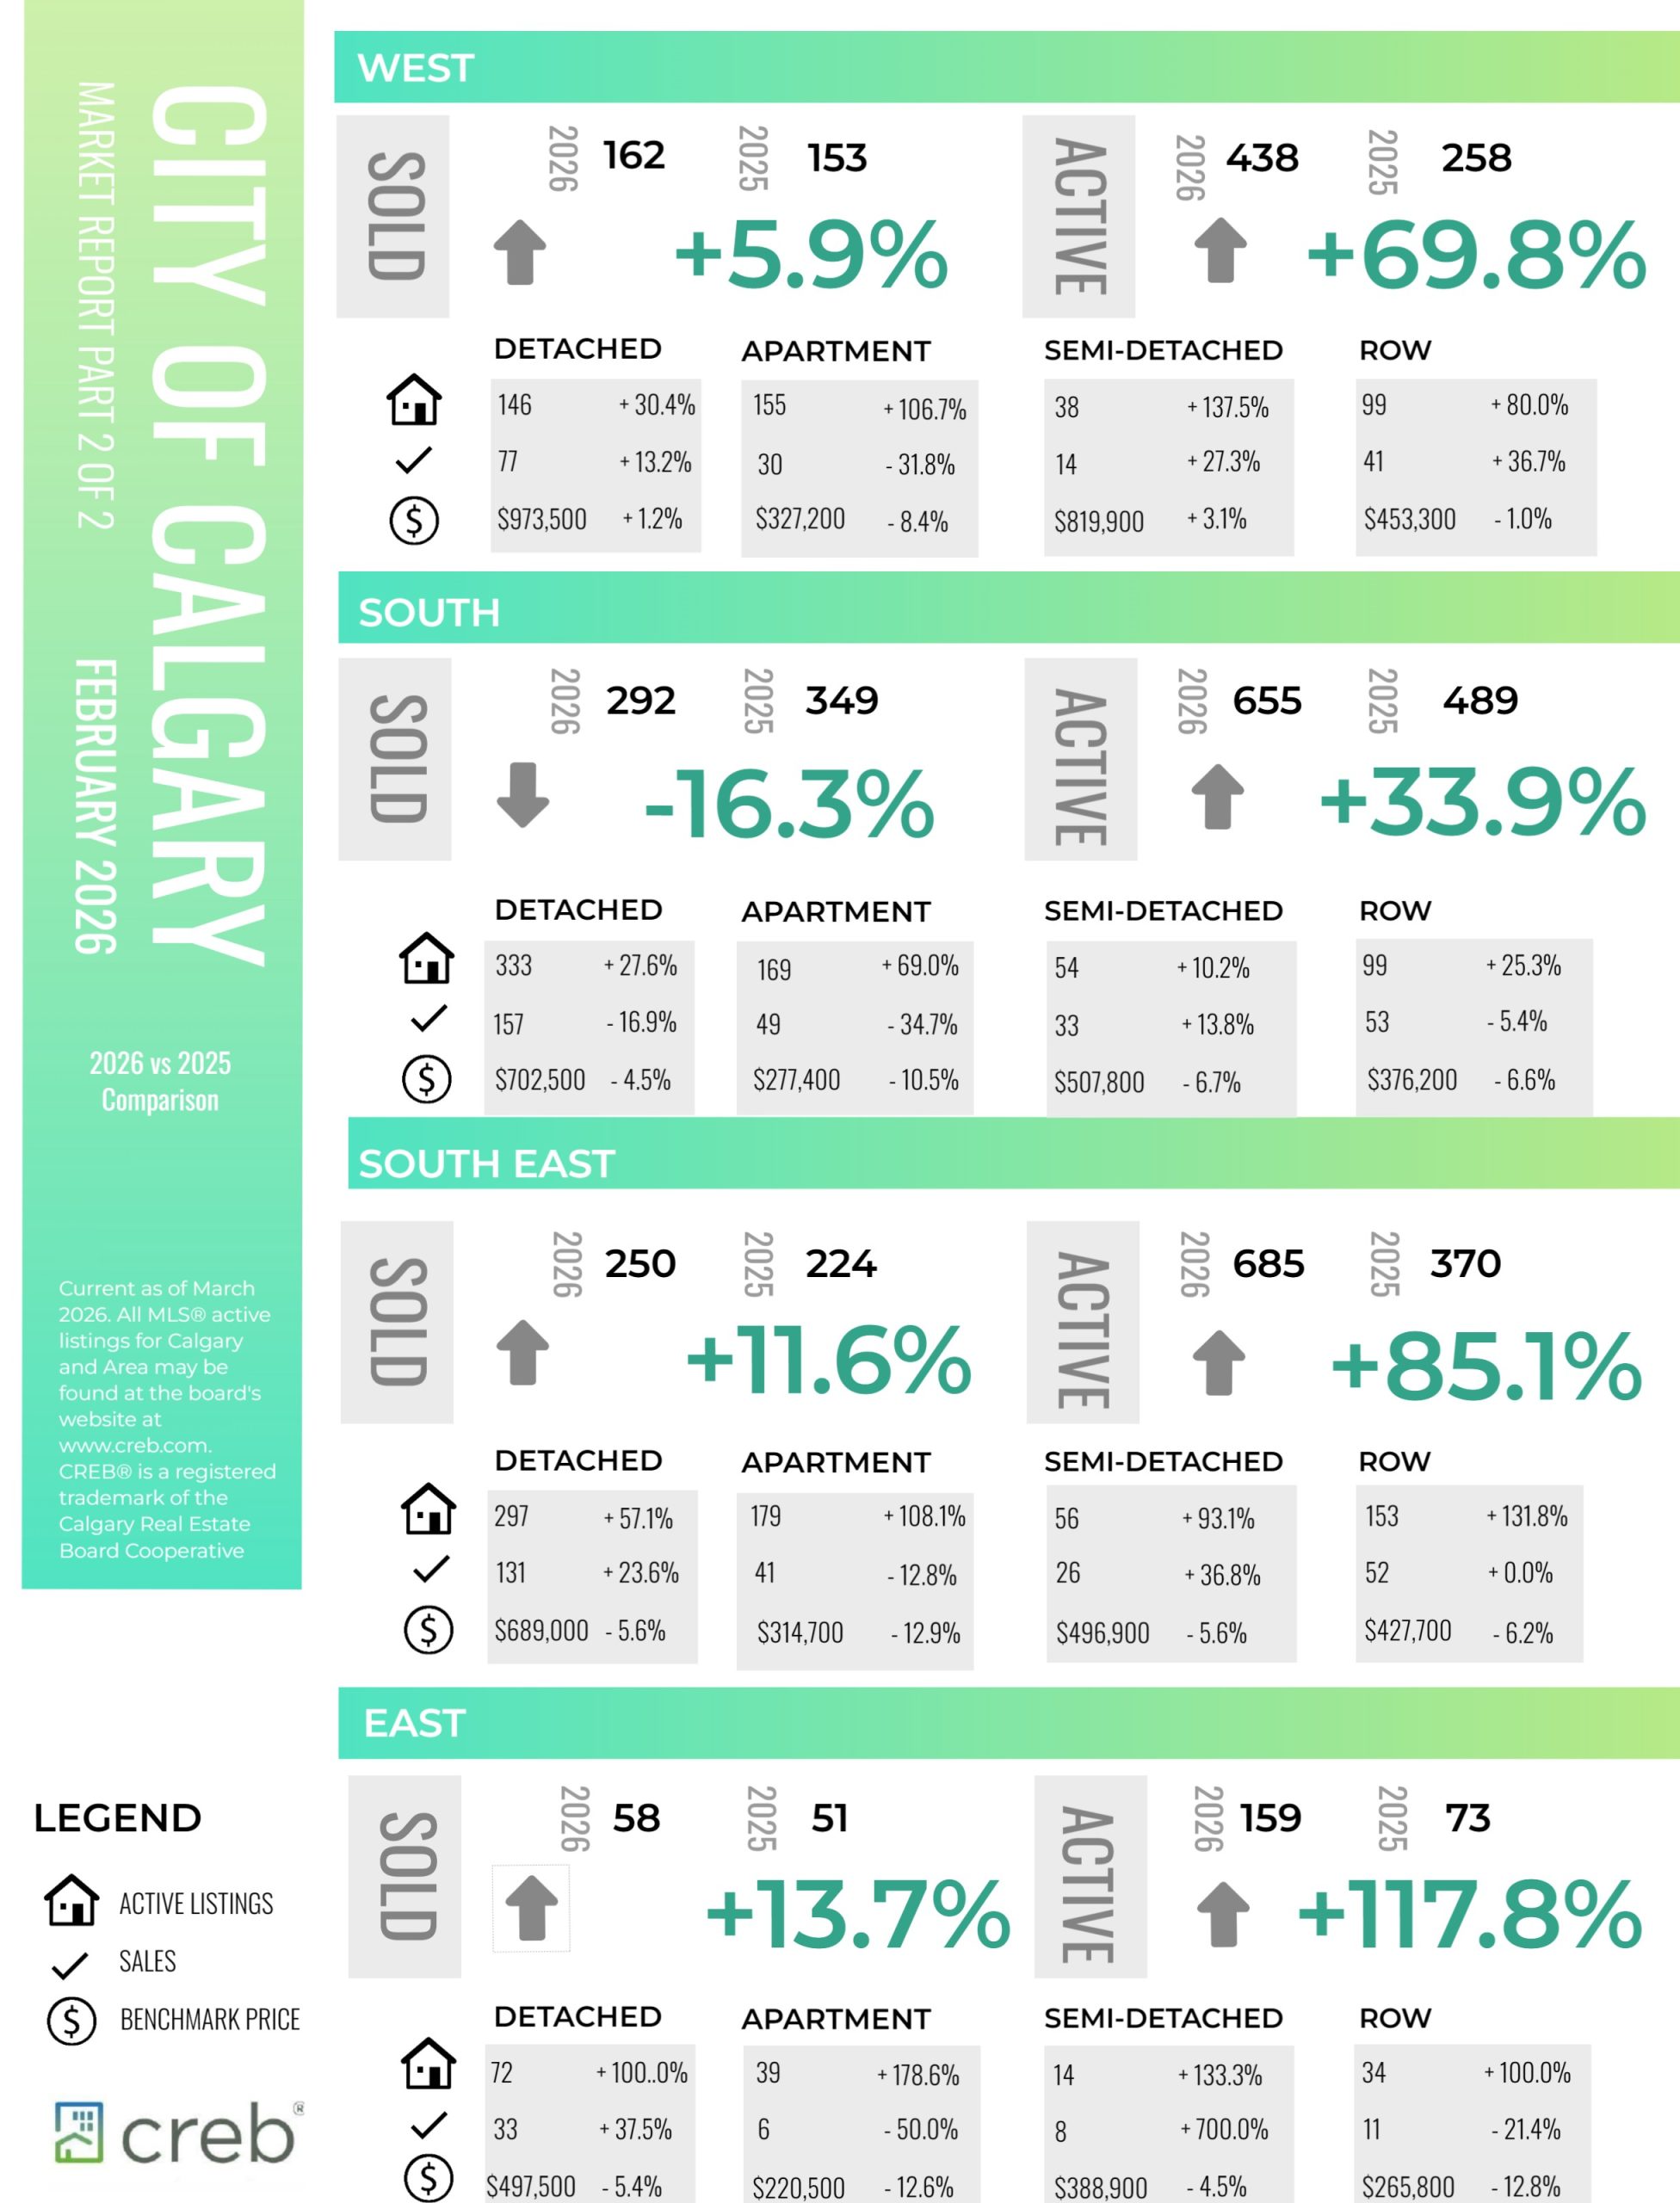
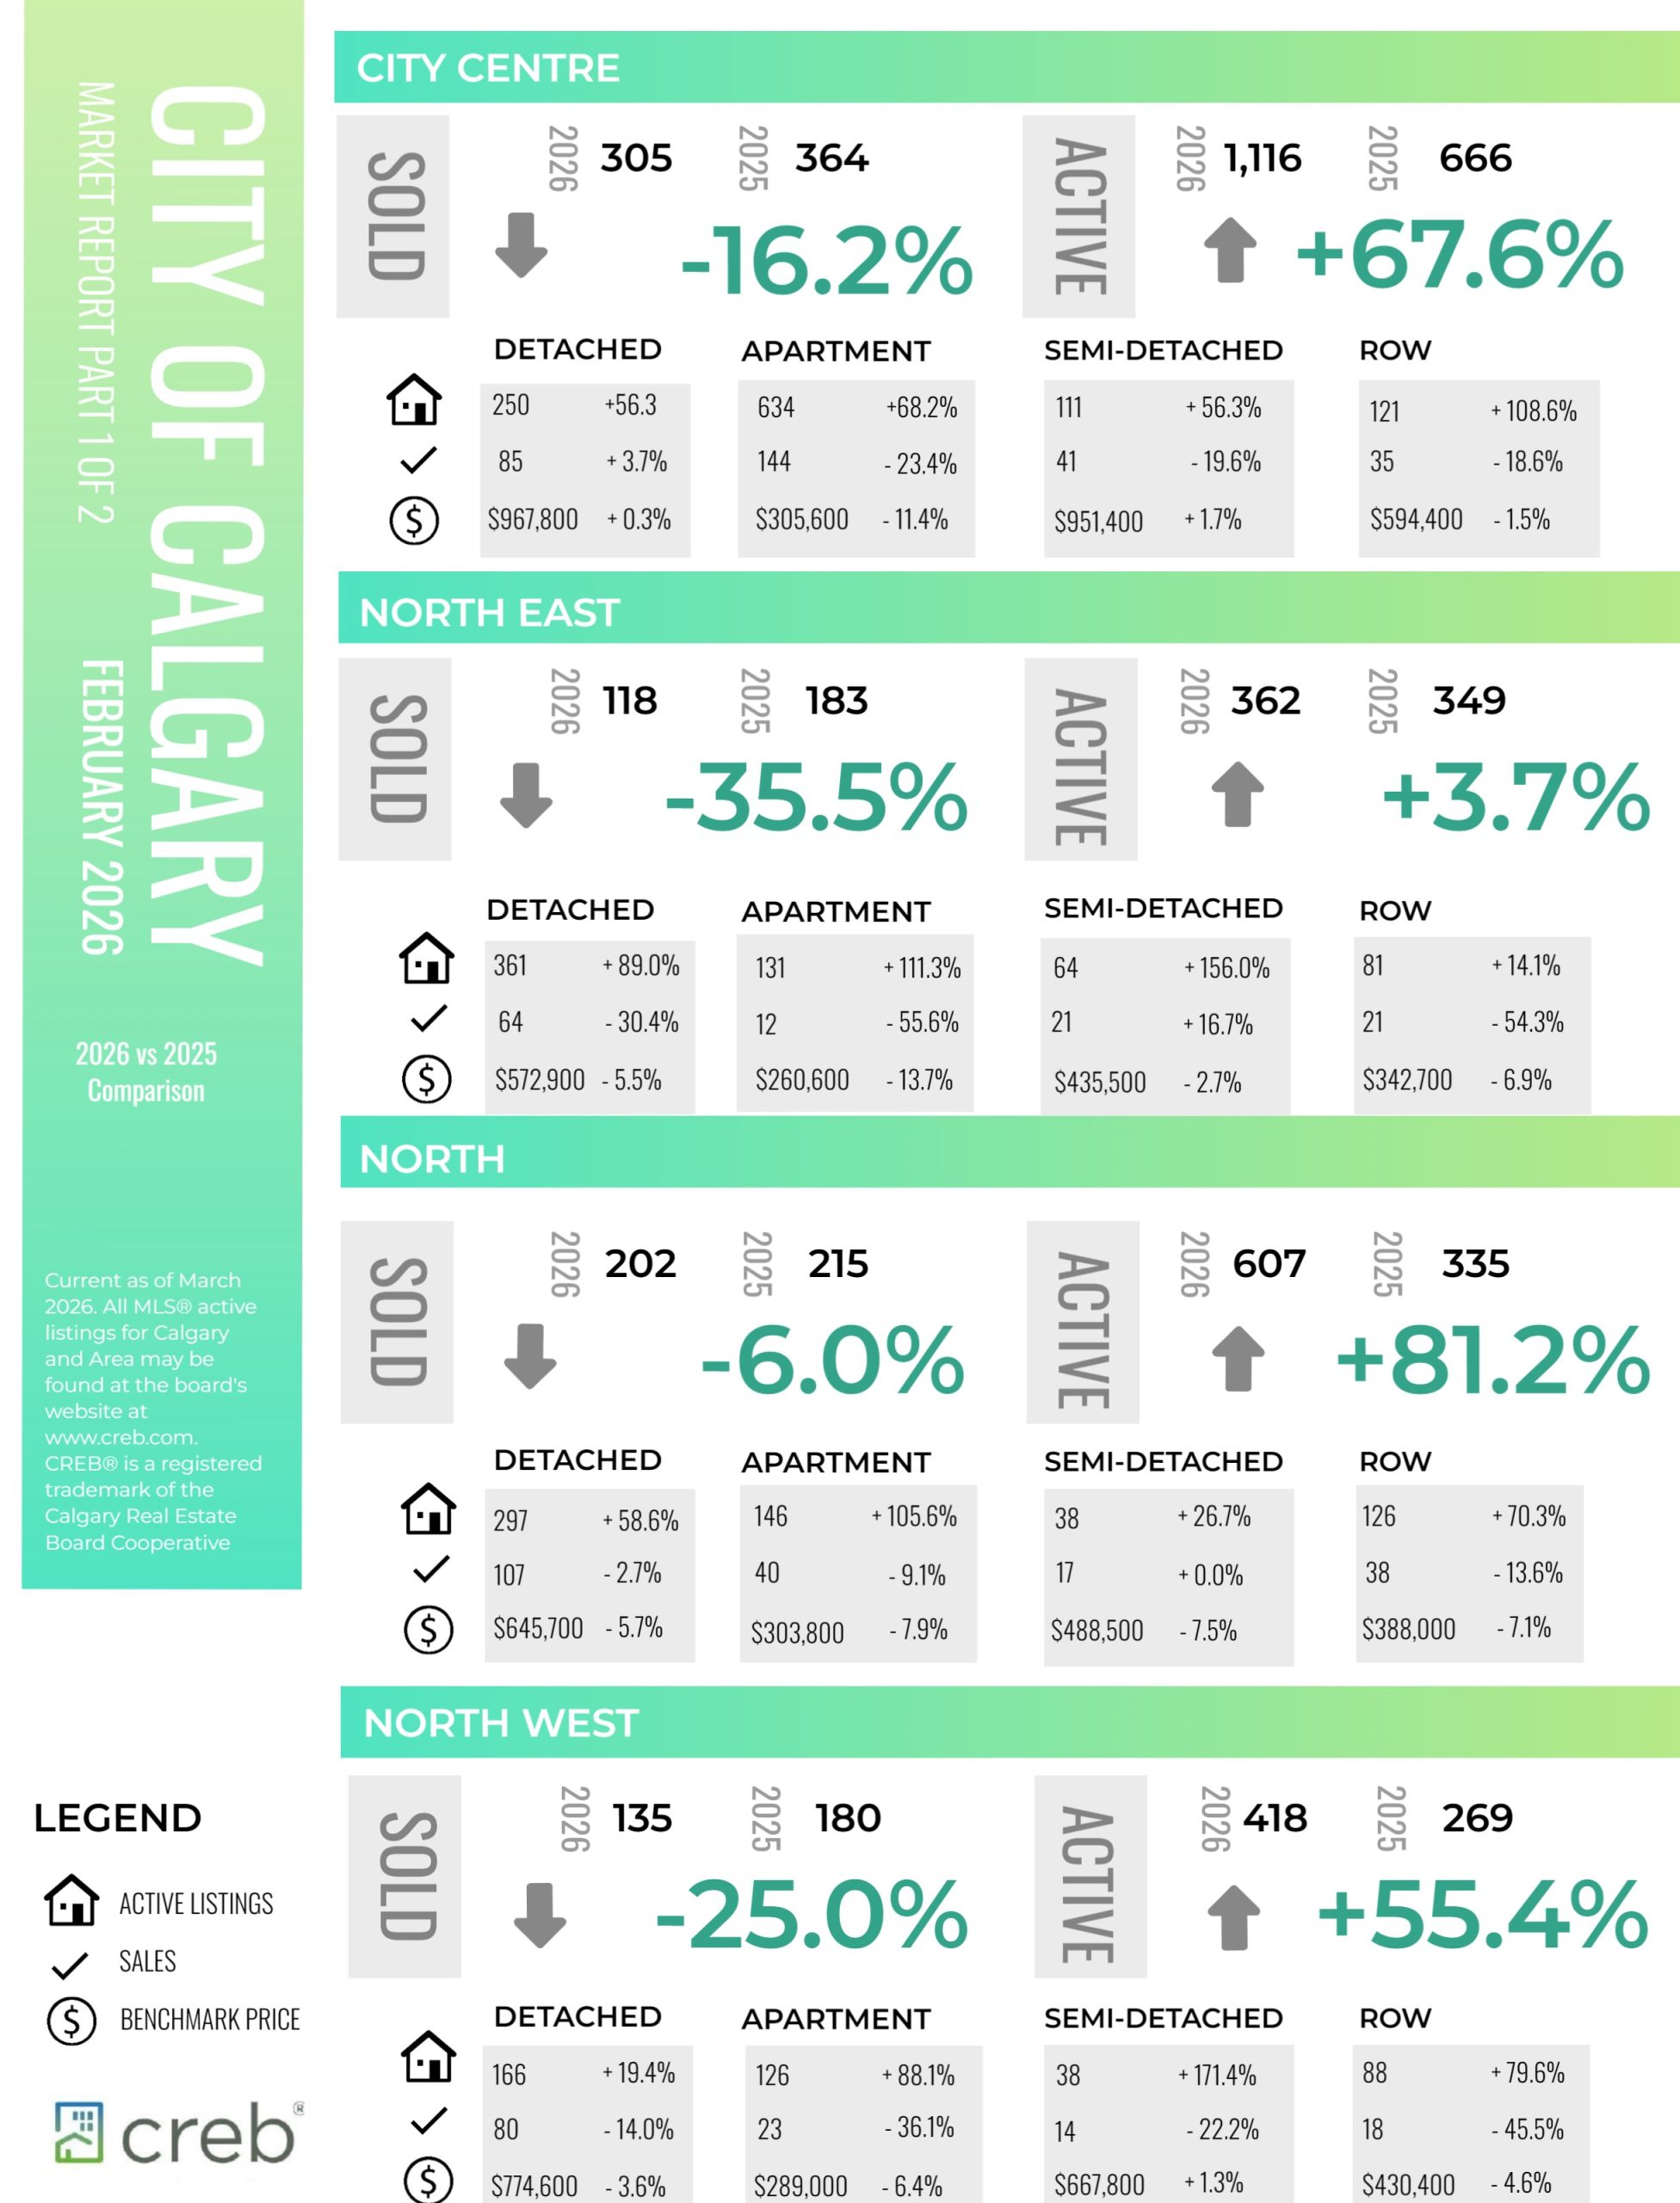
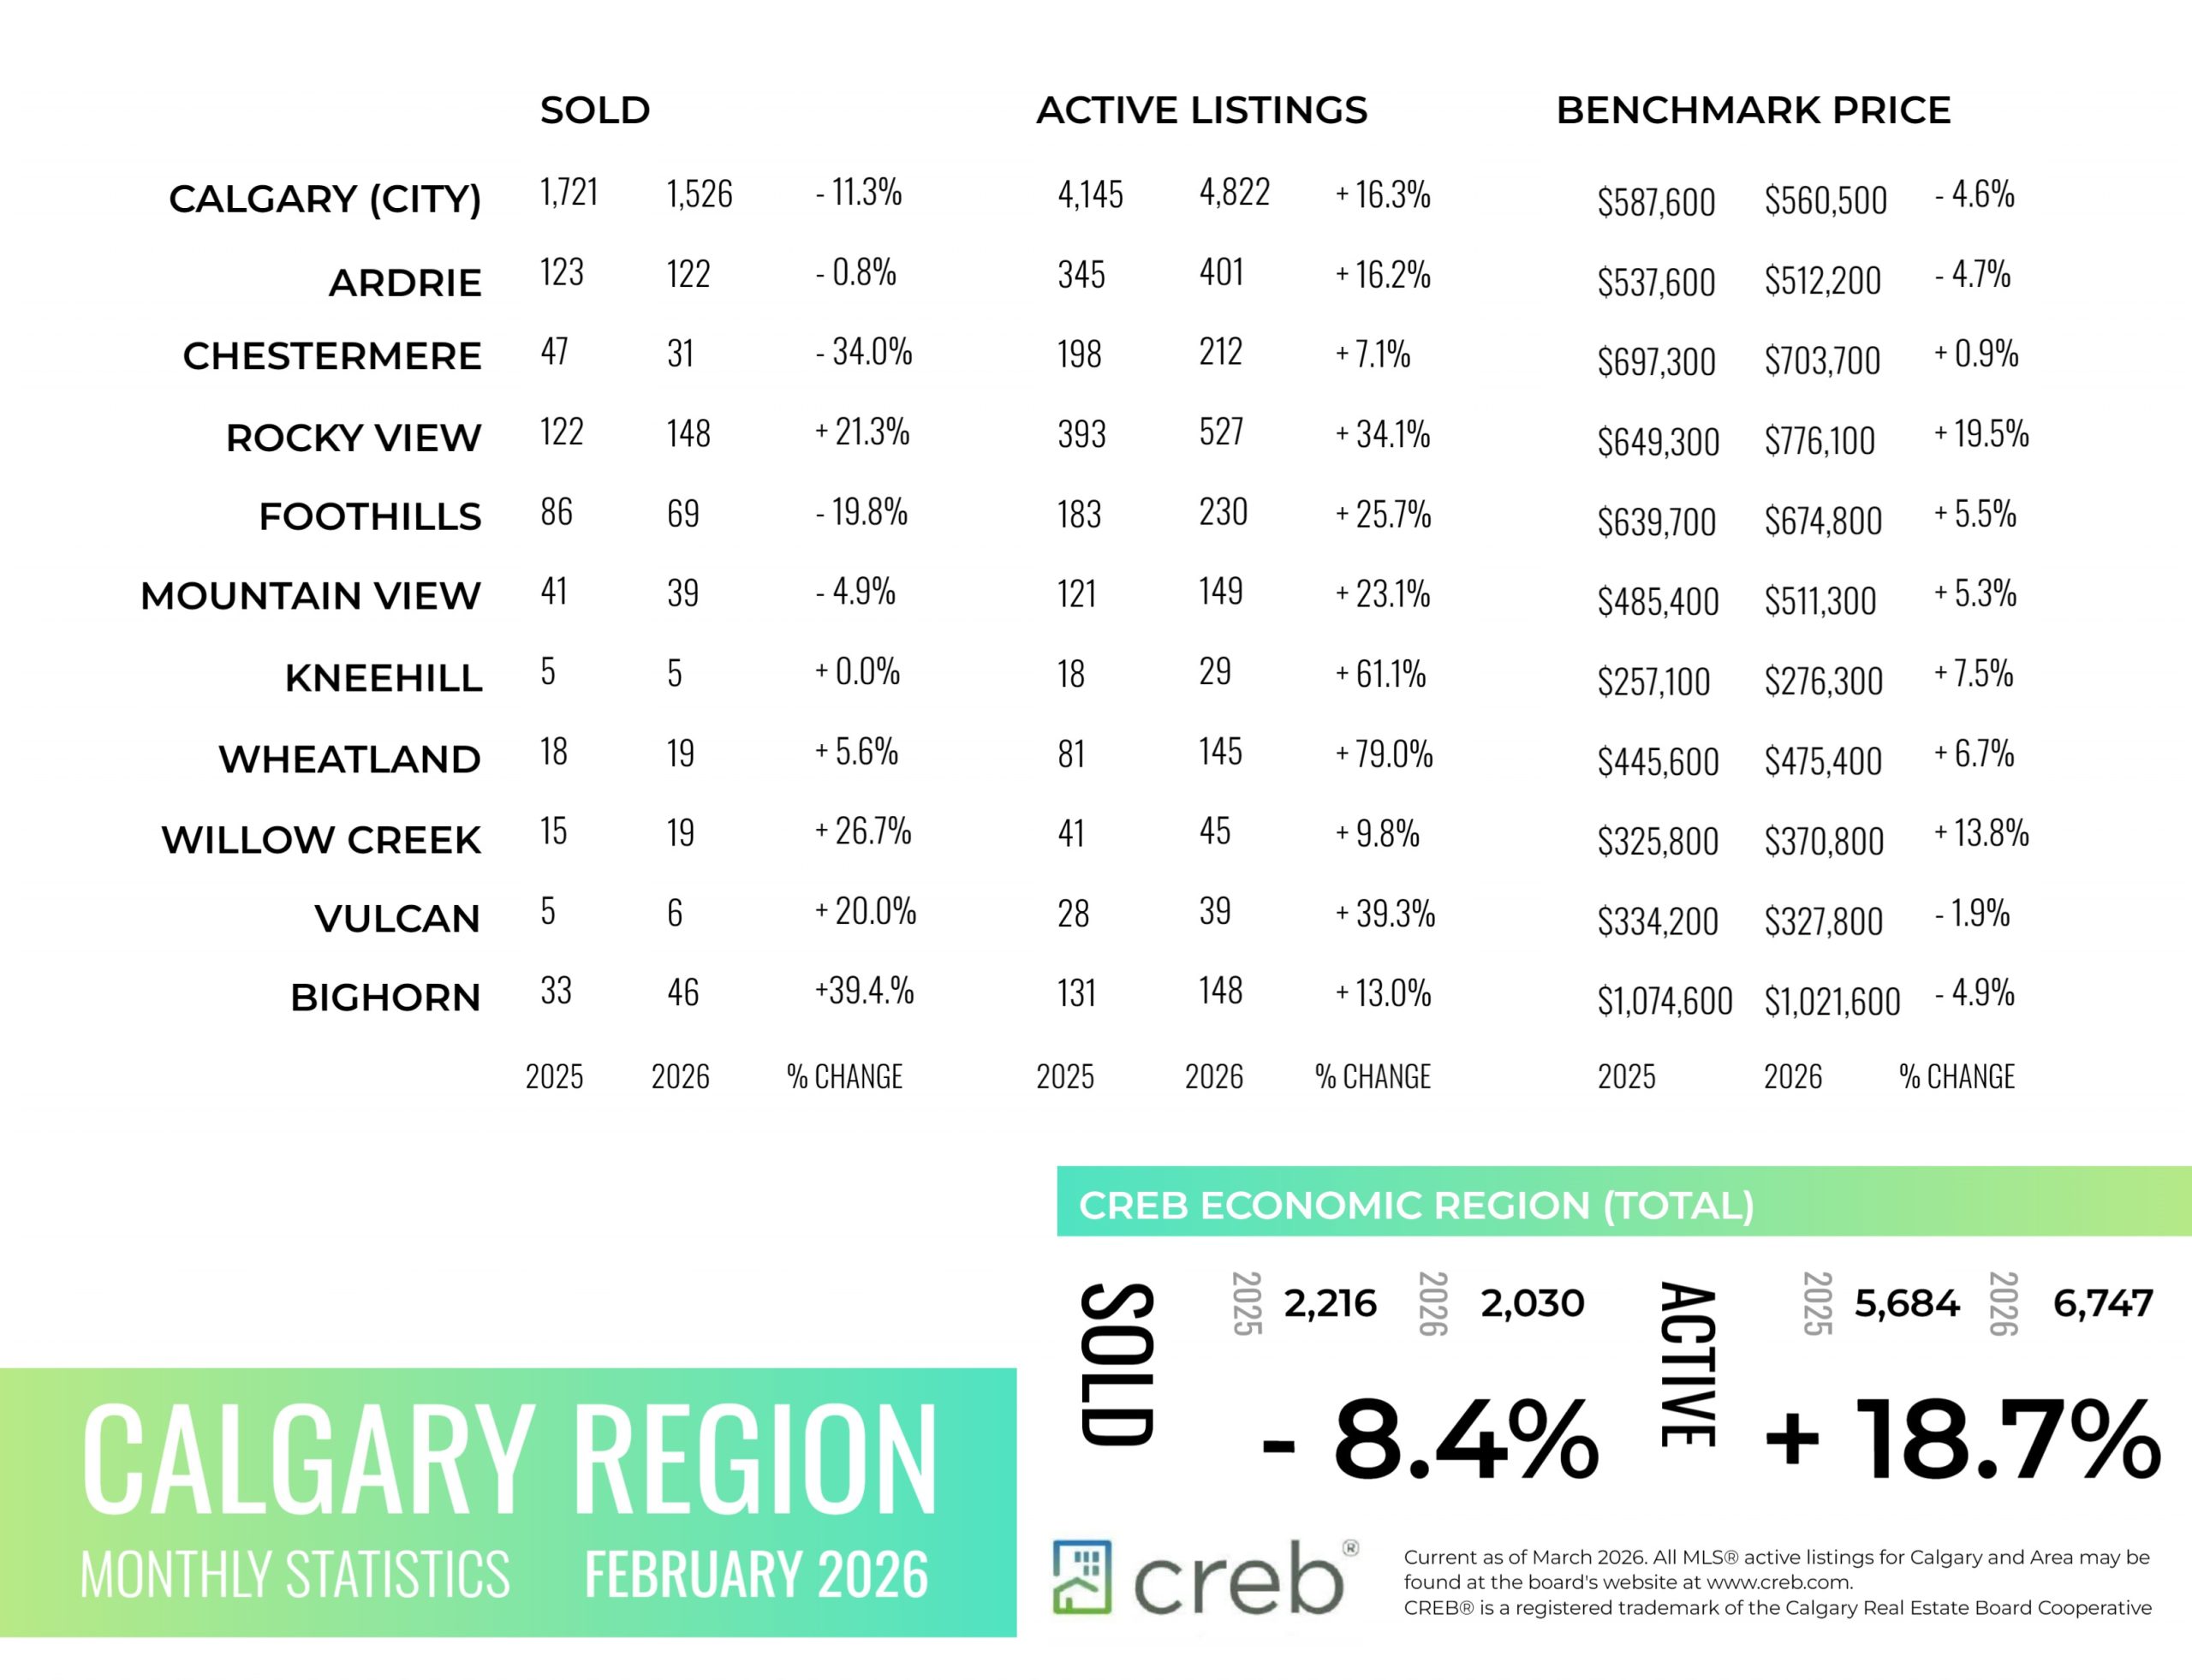
INFOGRAPHICS: February 2026 CREB City And Region Market Reports
Detached market tightens while apartments remain oversupplied
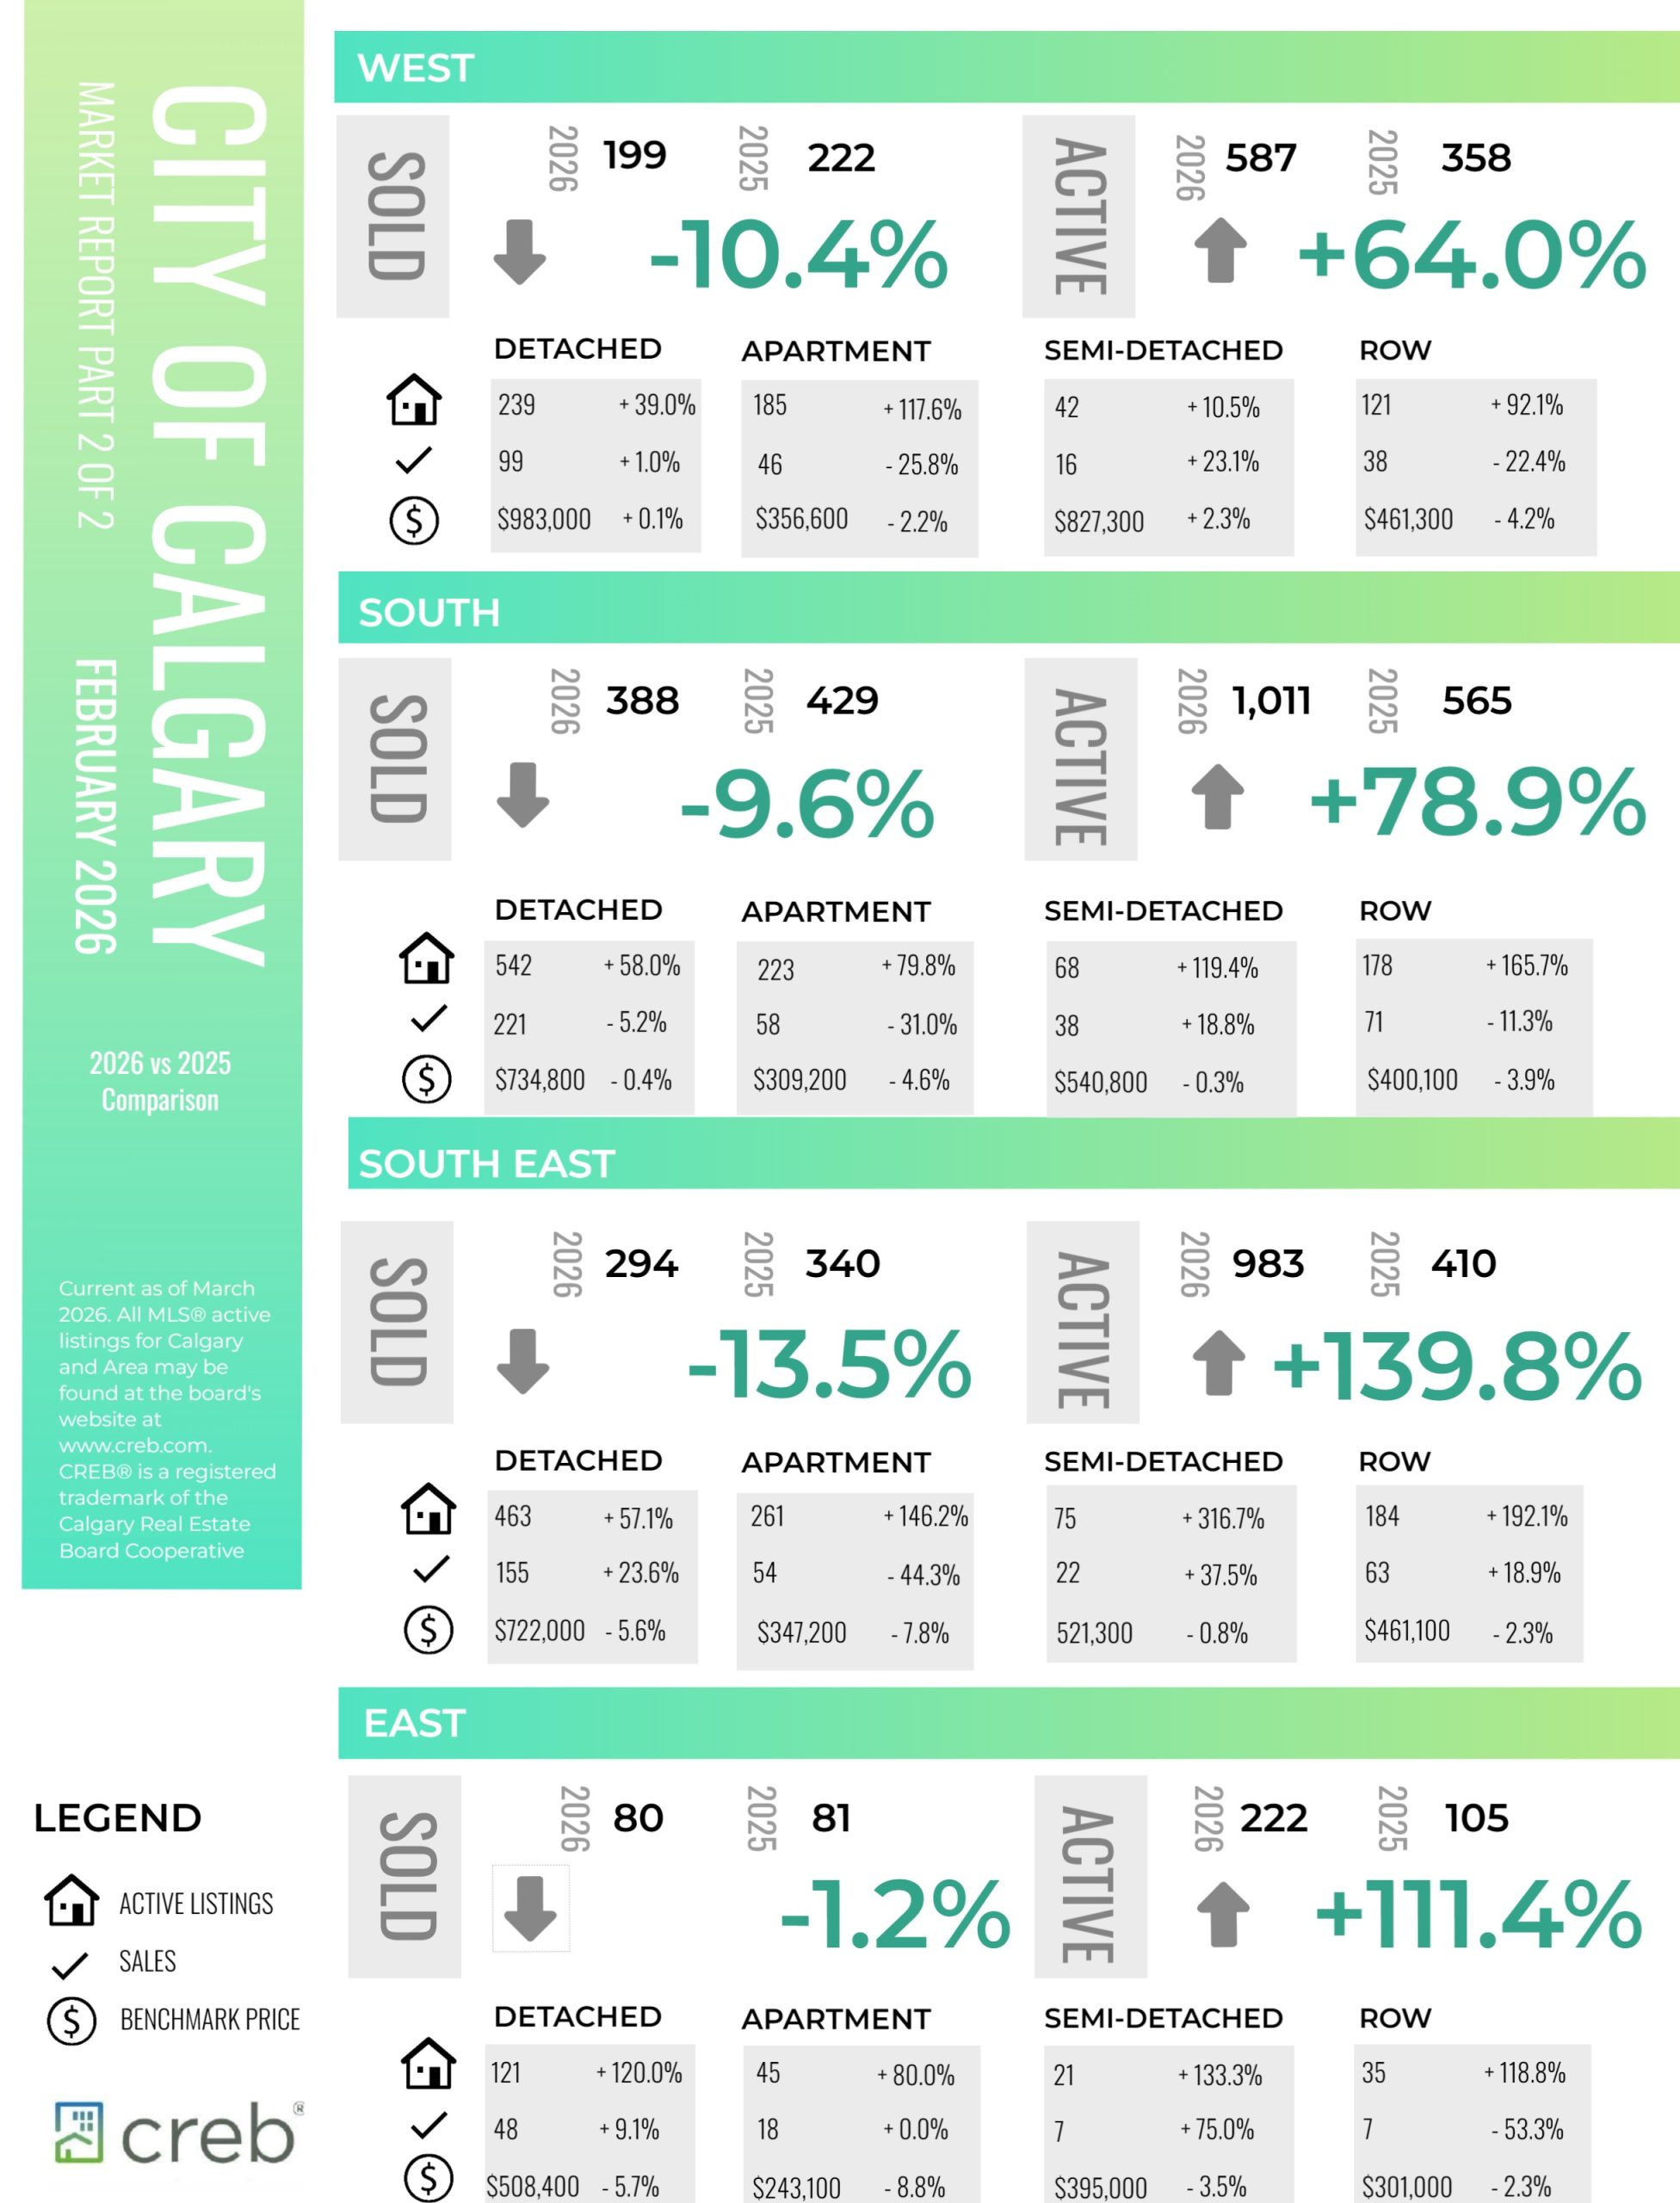
Calgary continued to see market conditions vary by property type in February. The tightest conditions occurred in detached and semi-detached properties, reporting less than three months of supply. Row homes reported slightly higher supply levels relative to demand but remained relatively balanced. Meanwhile, apartment-style properties are dealing with excess supply, as conditions continue to favour the buyer.
“Slowing migration levels are coming at a time when supply for apartment-style homes is rising. Calgary reported record high starts last year, mostly due to gains in apartment starts where there are nearly 18,000 units currently under construction. While a large share of the units is targeted for rental, this also impacts condo ownership markets,” said Ann-Marie Lurie, CREB®’s Chief Economist. “Meanwhile, on the opposite end of the spectrum, the detached market remains relatively balanced in the higher price ranges and continues to struggle with limited supply for homes priced below $700,000.”
Read the full report on the CREB website!
The following data is a comparison between February 2026 and February 2025 numbers, and is current as of January of 2026. For last month’s numbers, check out our previous infographic.
Or follow this link for all our CREB Infographics!
Click on the images for a larger view!
Download Printable Version – February 2026 CREB, City of Calgary Report Pages 1 and 2
Download Printable Version – February 2026 CREB, Calgary Region Report
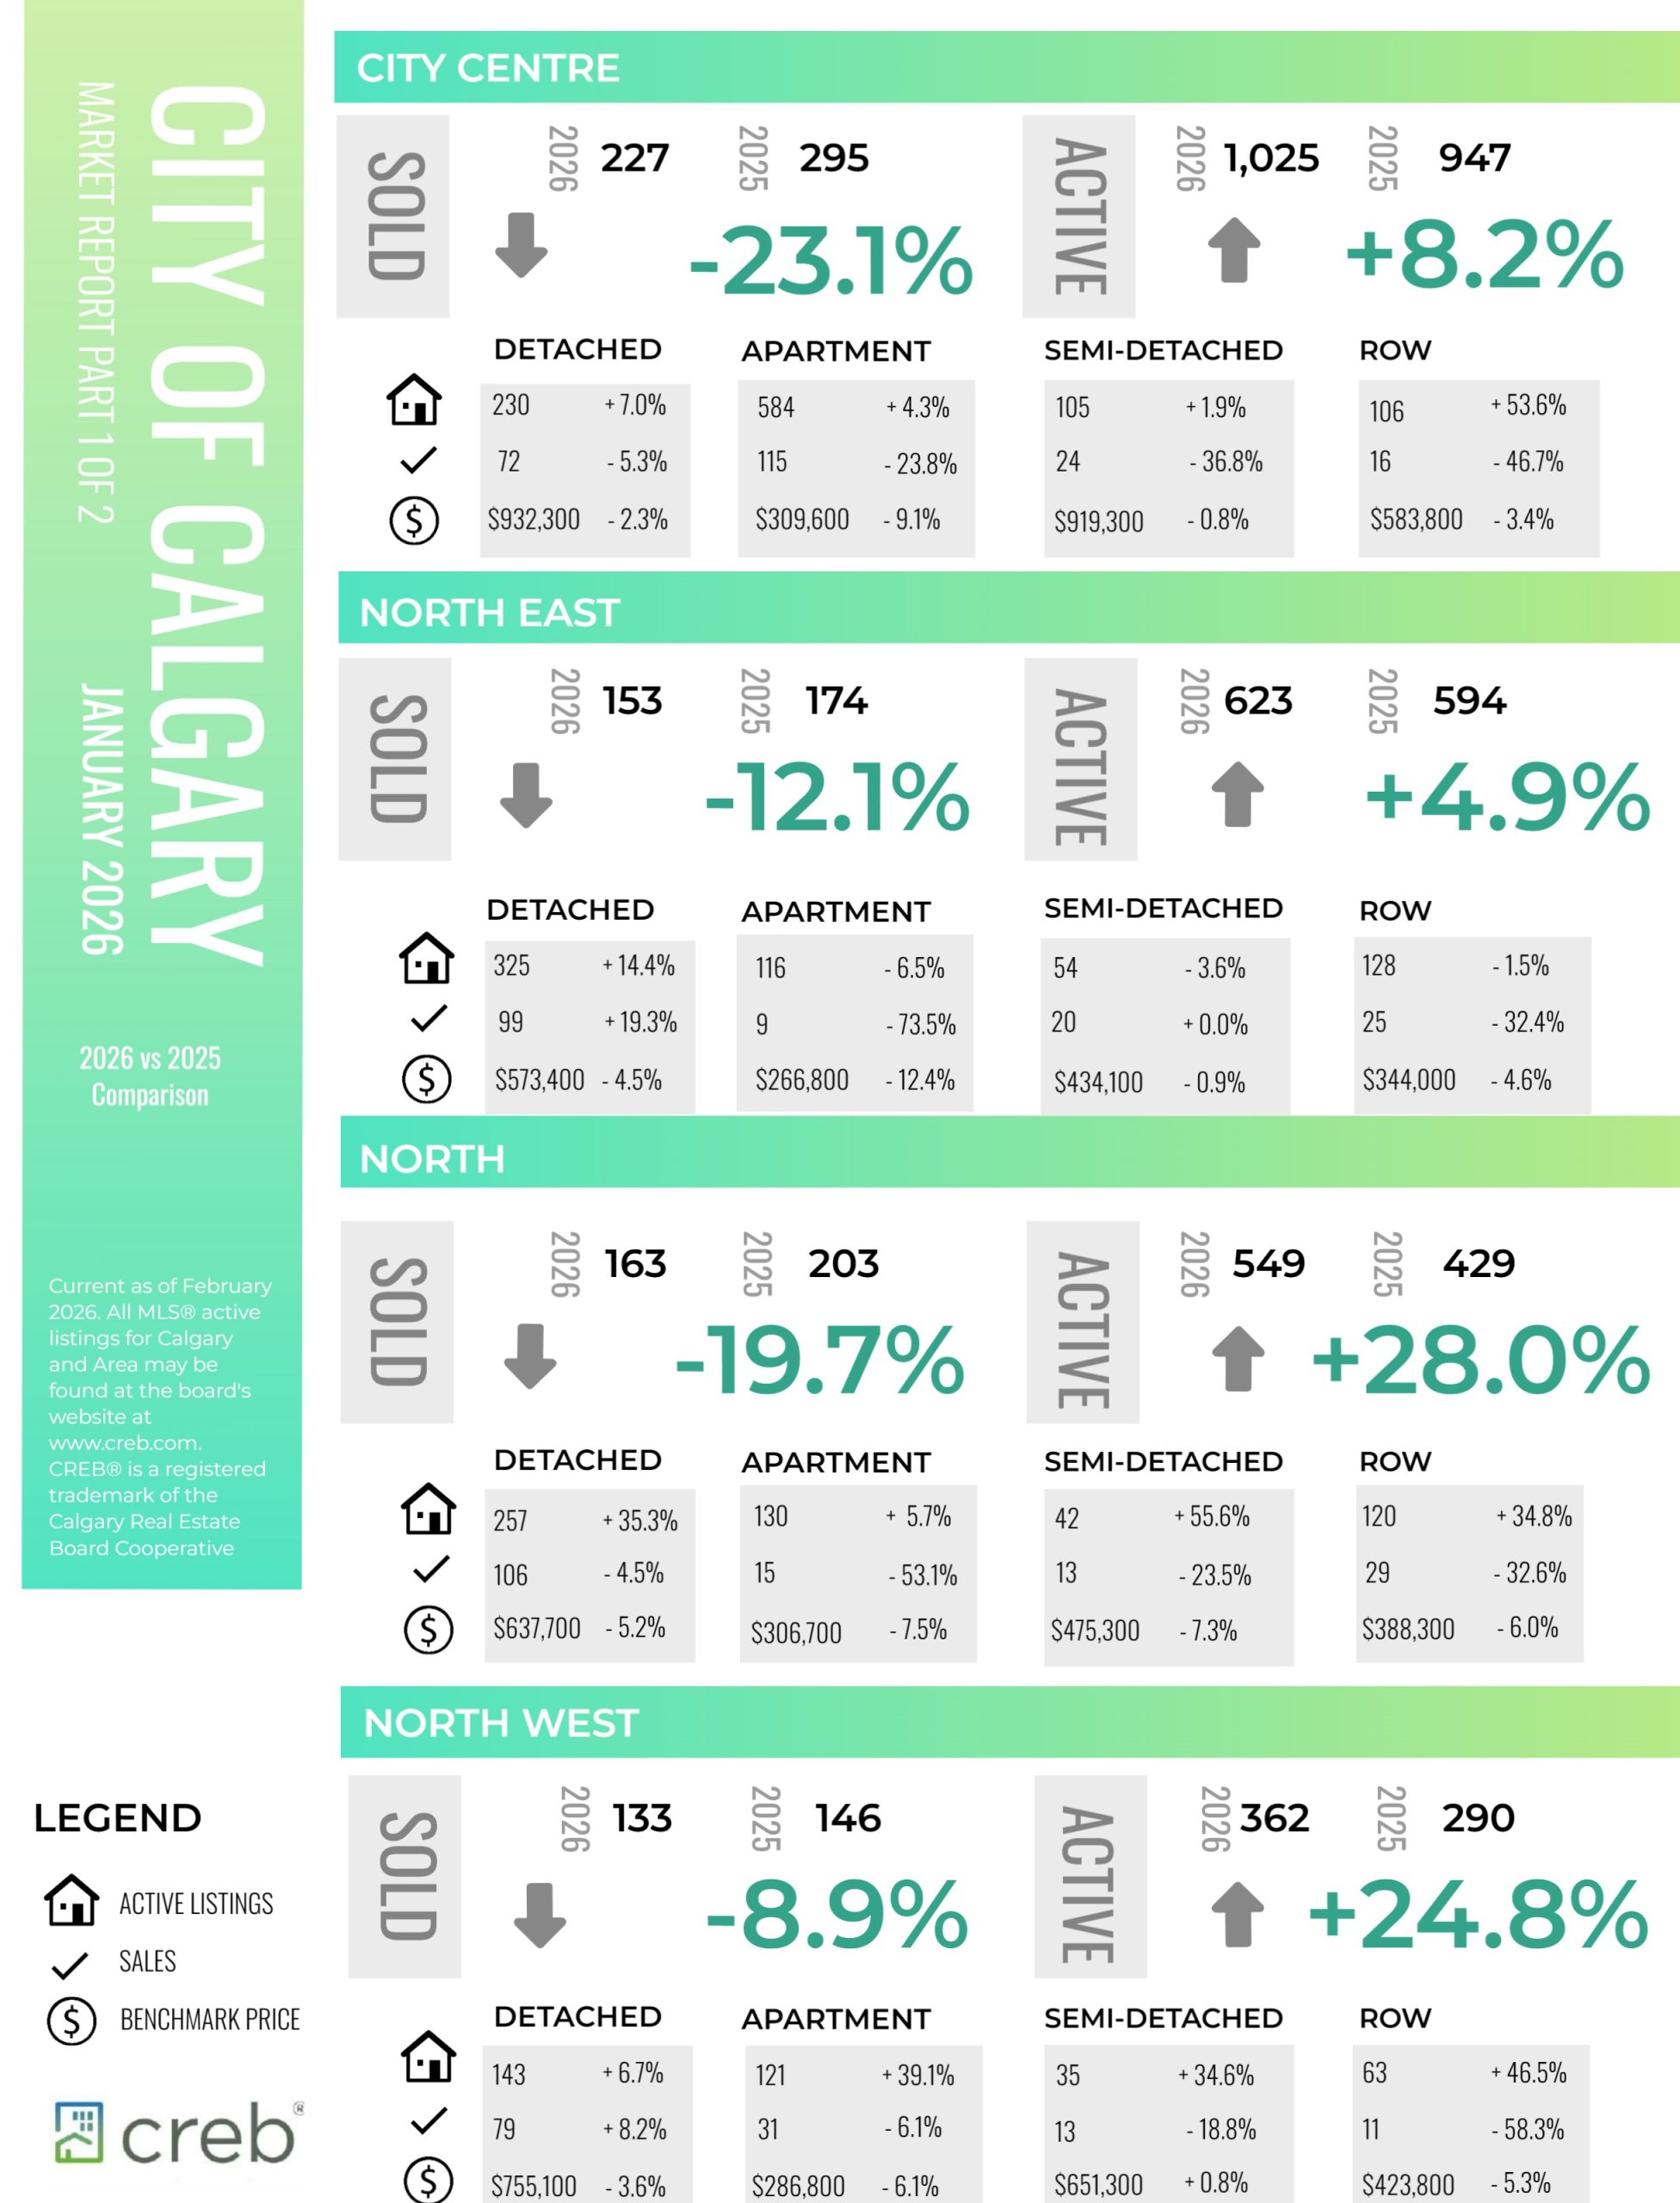
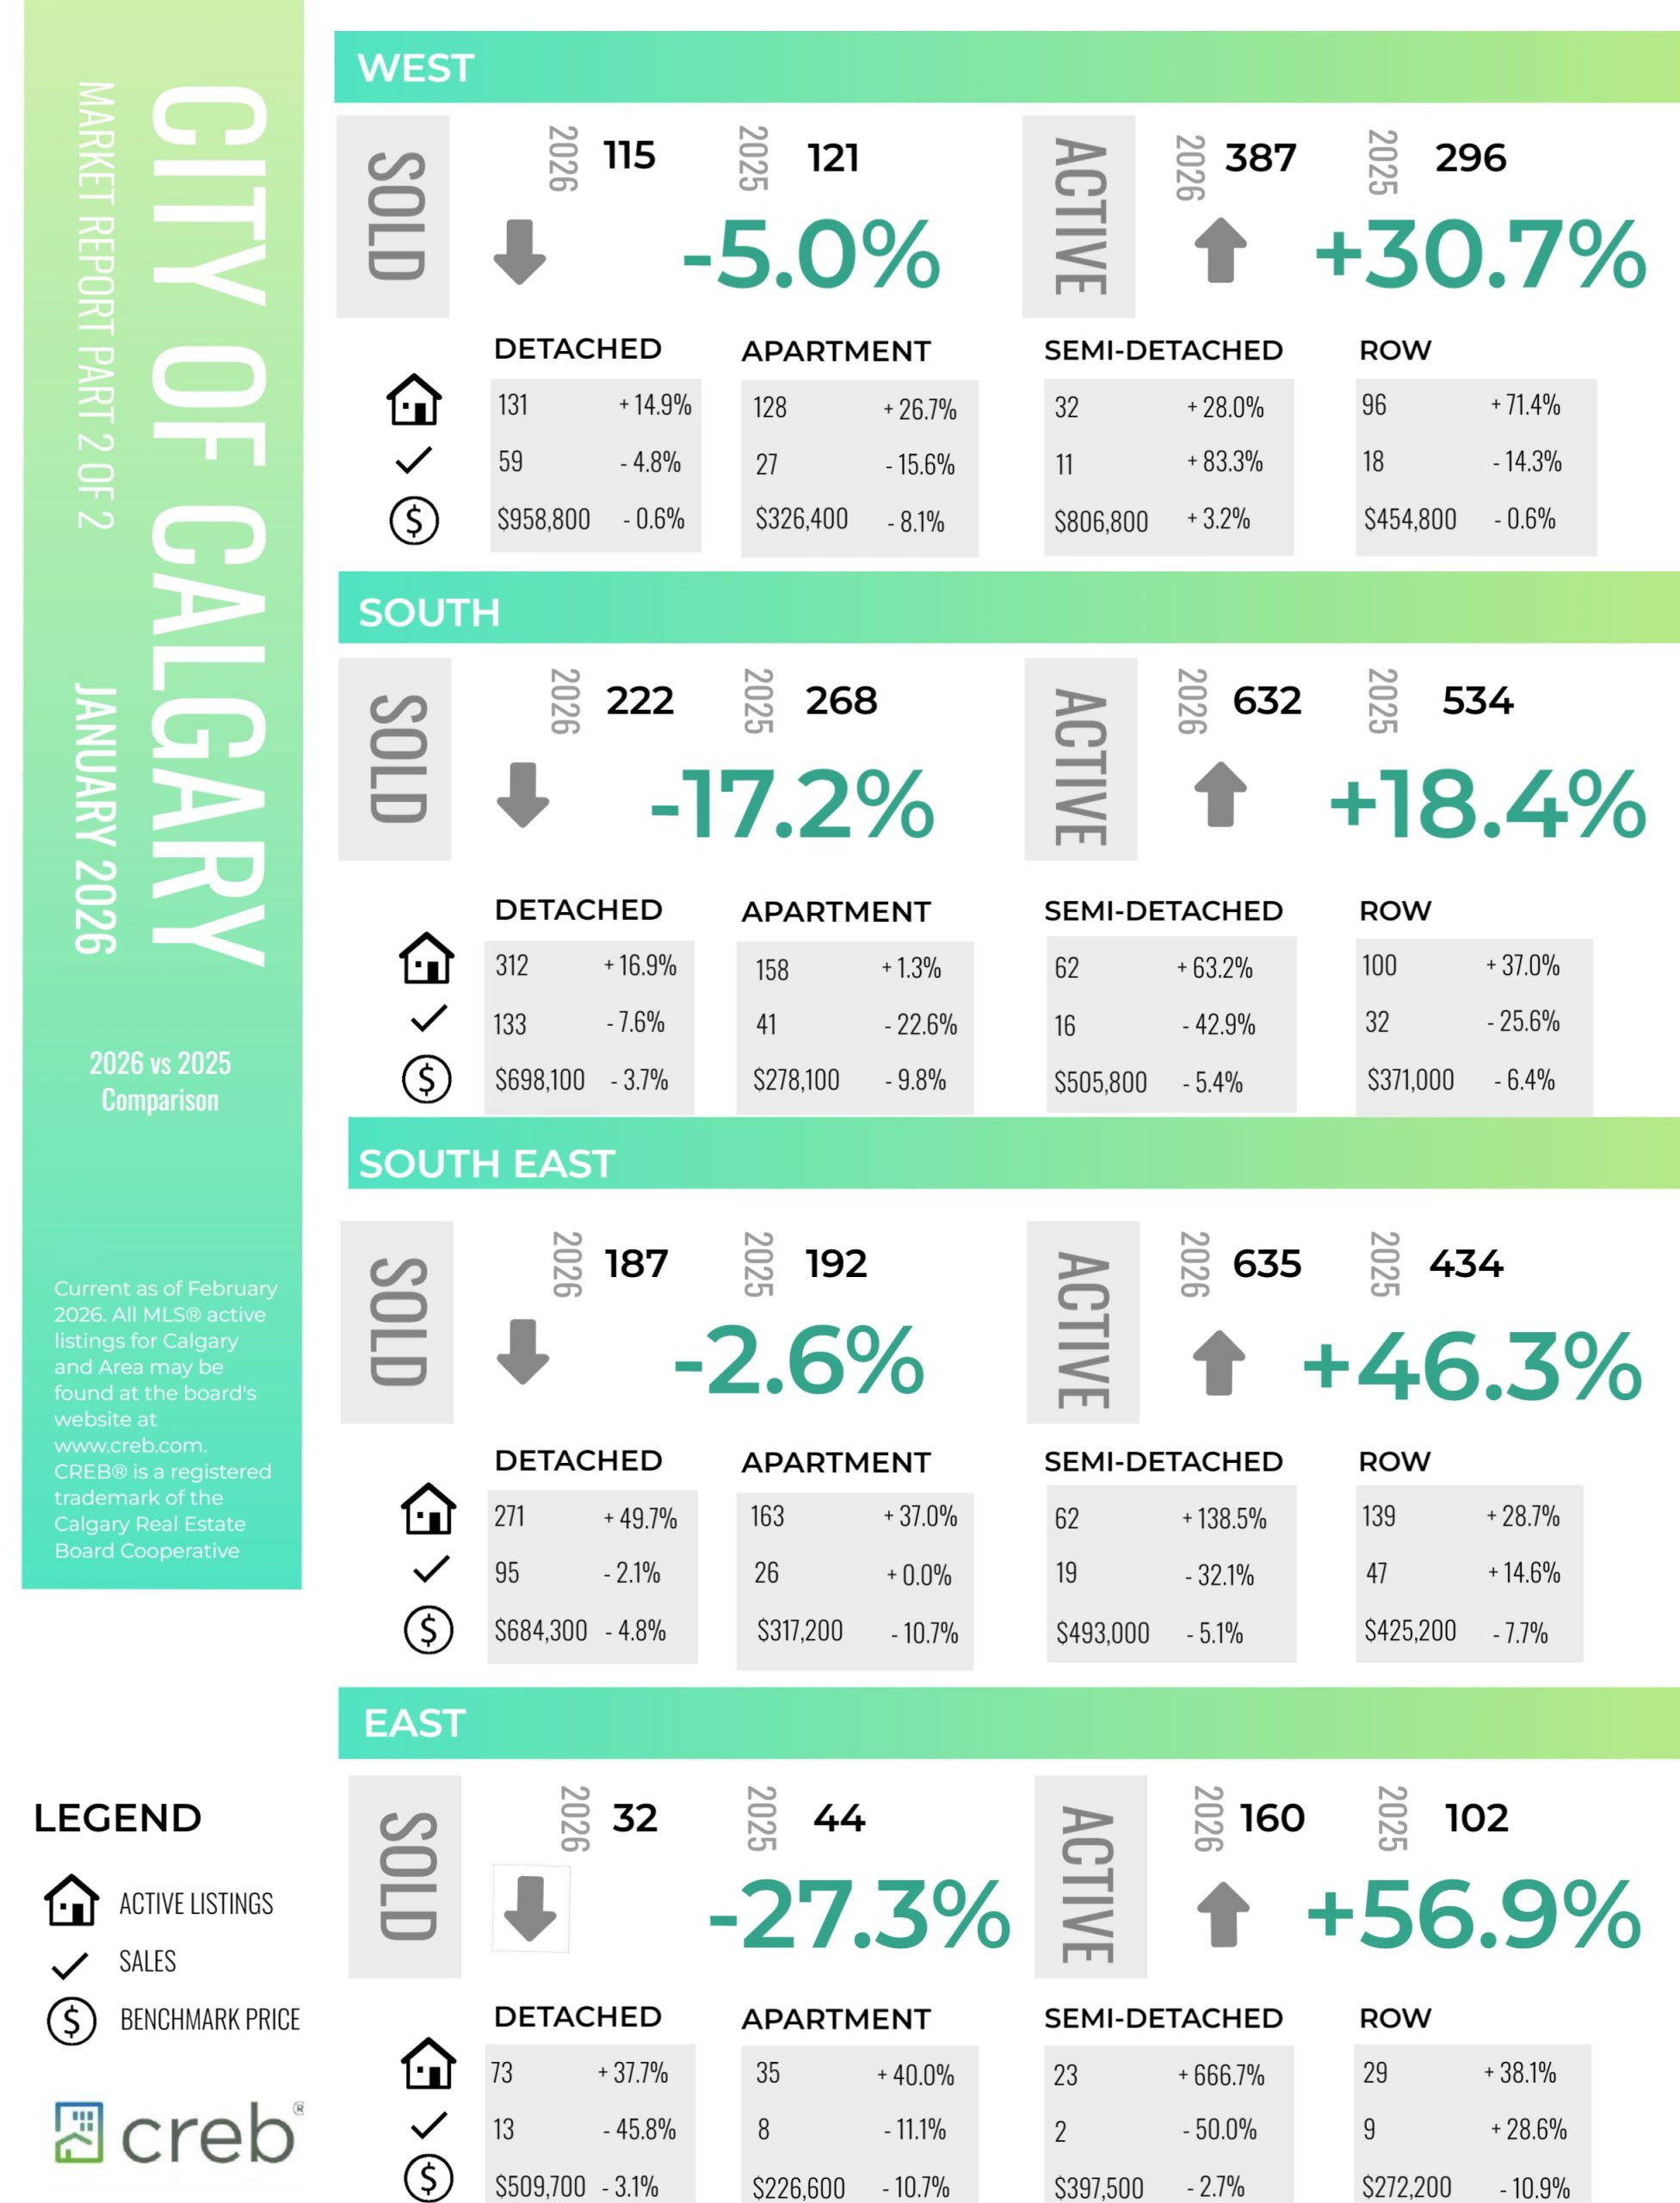
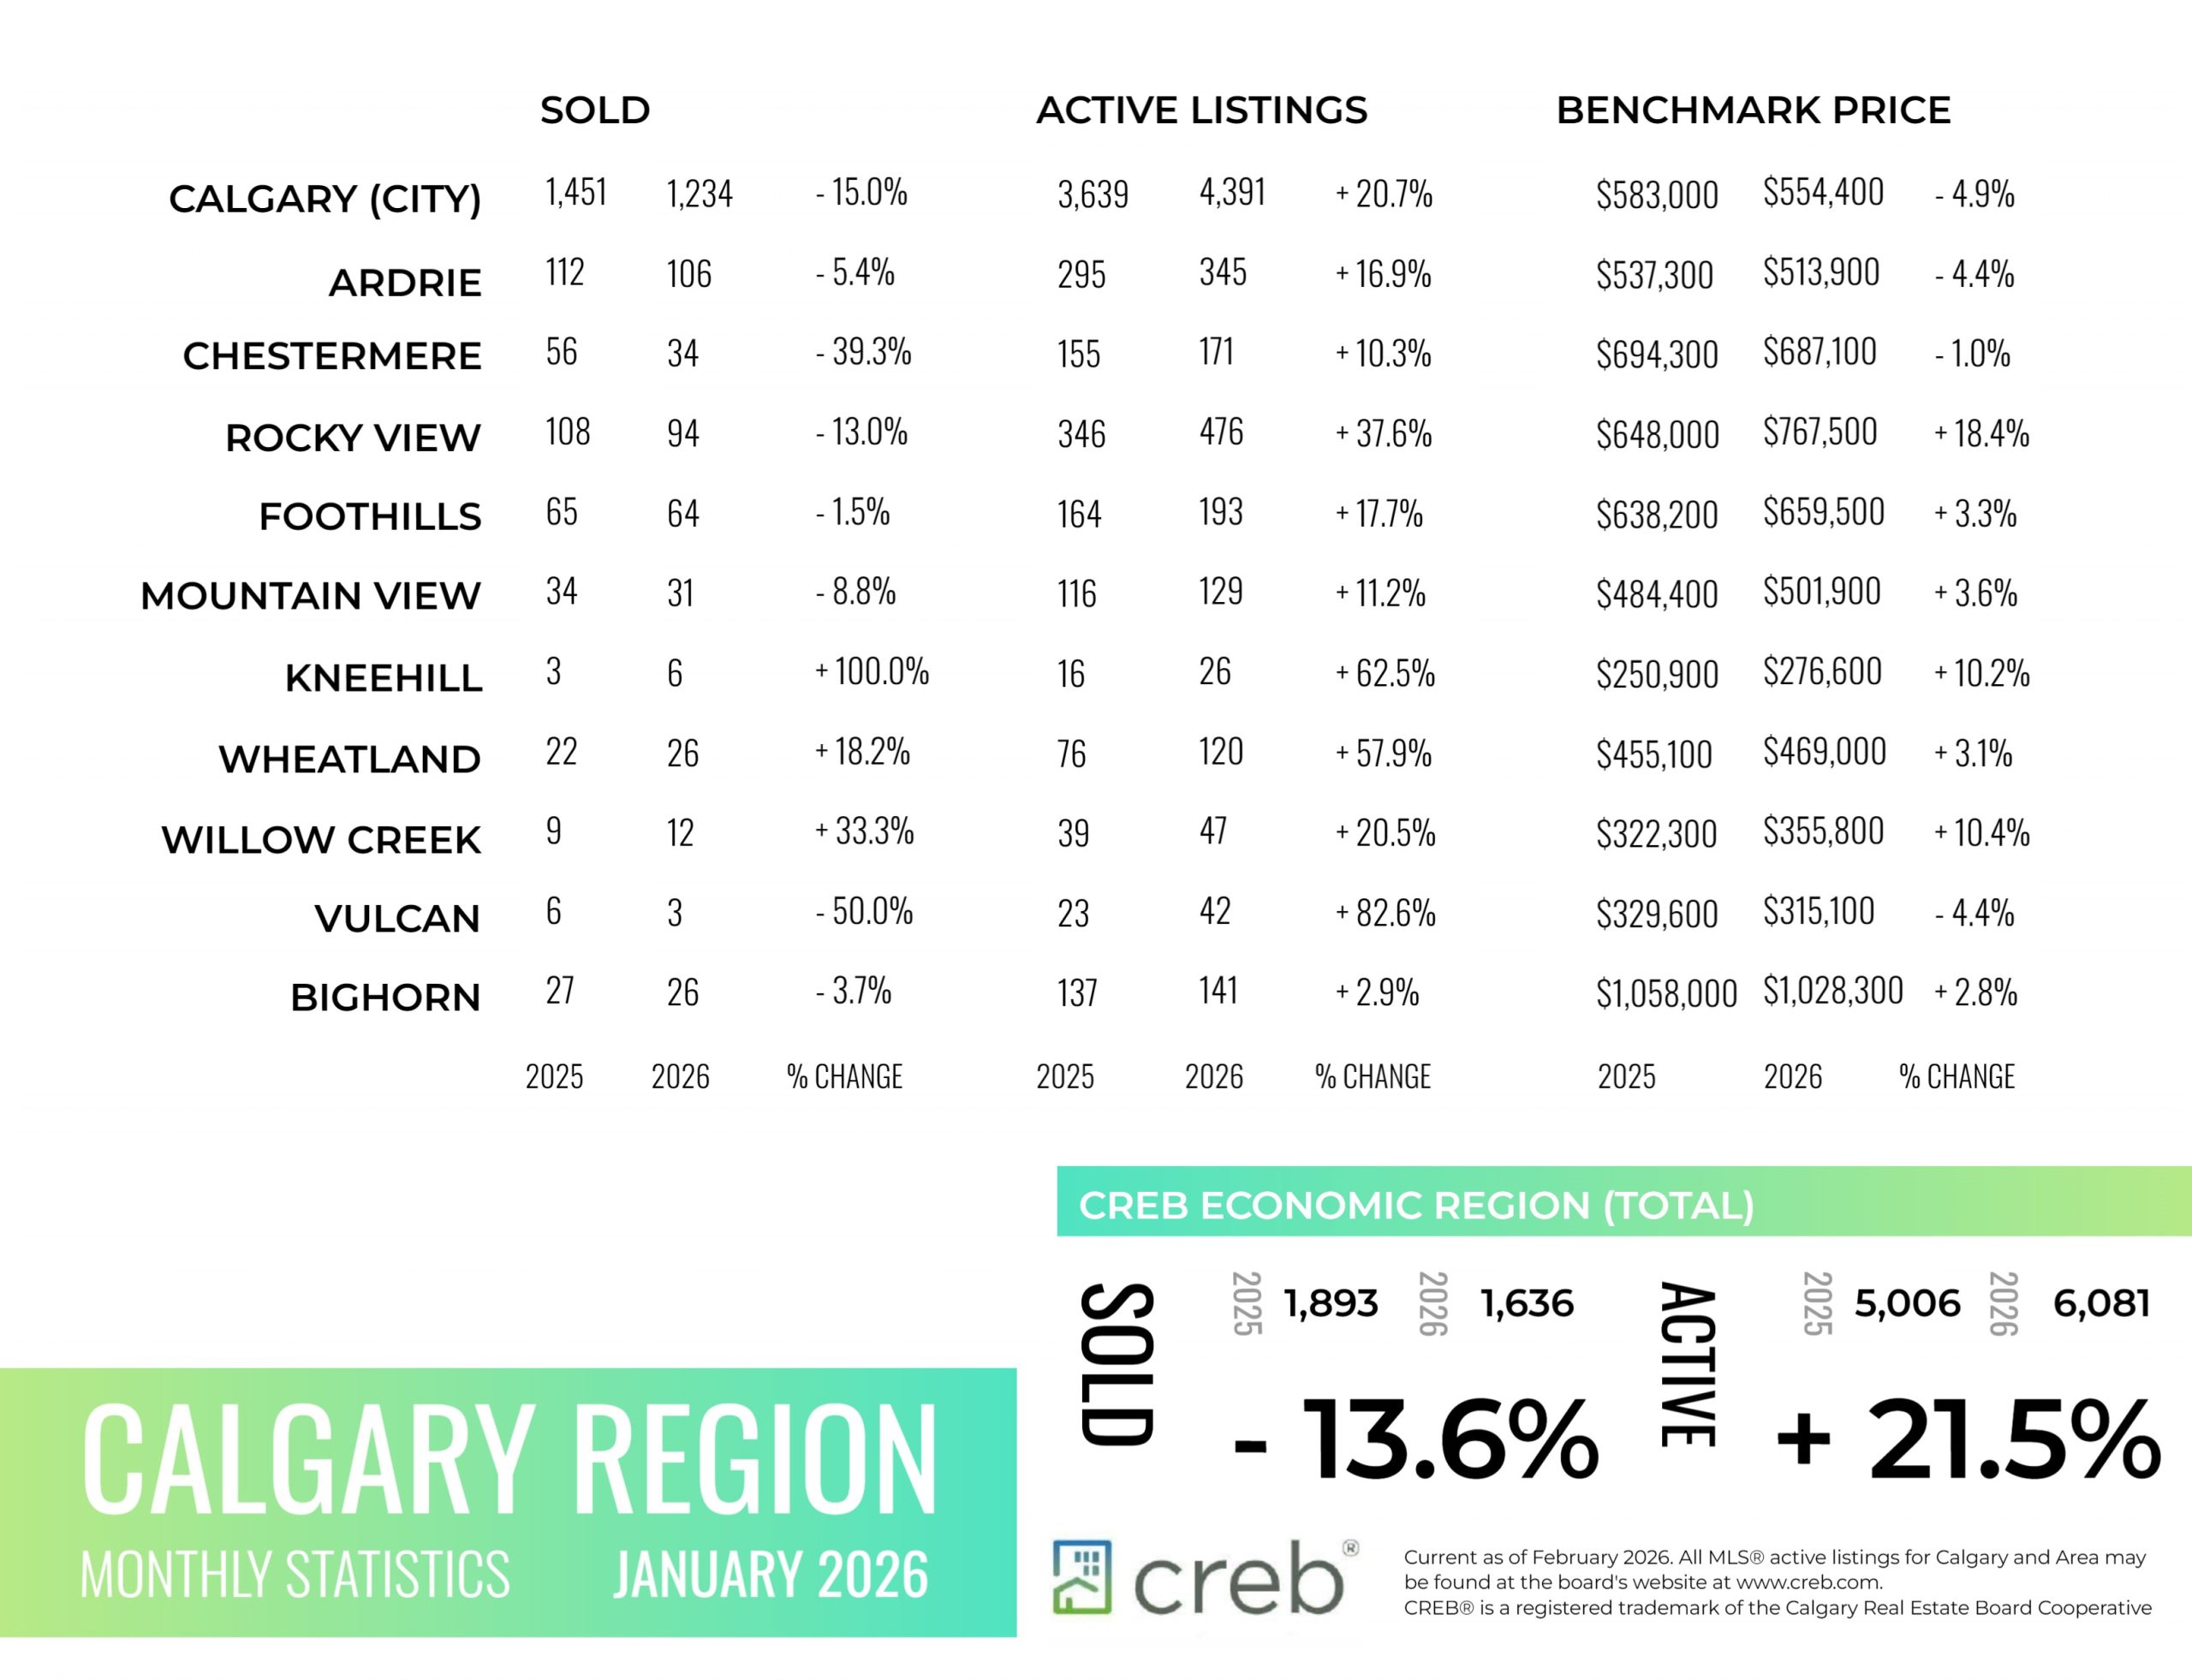
INFOGRAPHICS: January 2026 CREB City And Region Market Reports
Slow start for high-density homes
Calgary reported 1,234 sales in January, a year-over-year decline of 15 per cent, but in line with typical levels of activity for the month. While sales declined across all property types, the steepest declines occurred in higher-density homes.
“Following the typical December slowdown, potential buyers for high-density homes were more hesitant to return to the market in January, as increased supply choice across all aspects of the market has reduced the sense of urgency,” said Ann-Marie Lurie, CREB®’s Chief Economist. “At the same time, sellers were quick to bring their listings onto the market, causing the sales-to-new-listings ratio to drop to 44 per cent, mostly due to shifts in apartment and row-style homes. Overall, this is not entirely uncommon for January, as both buyers and sellers weigh their options ahead of the spring market.”
The rise in new listings compared to sales caused inventory levels to increase to 4,391 units, the highest January level since 2020. However, as with sales, conditions vary by property type, with row and apartment homes facing higher levels of inventory compared to long-term trends. The result is months of supply that ranges from under three months in the detached sector to five months for apartment-style homes.
Read the full report on the CREB website!
The following data is a comparison between January 2026 and January 2025 numbers, and is current as of February of 2026. For last month’s numbers, check out our previous infographic.
Or follow this link for all our CREB Infographics!
Click on the images for a larger view!
Download Printable Version – January 2026 CREB, City of Calgary Report Pages 1 and 2
Download Printable Version – January 2026 CREB, Calgary Region Report
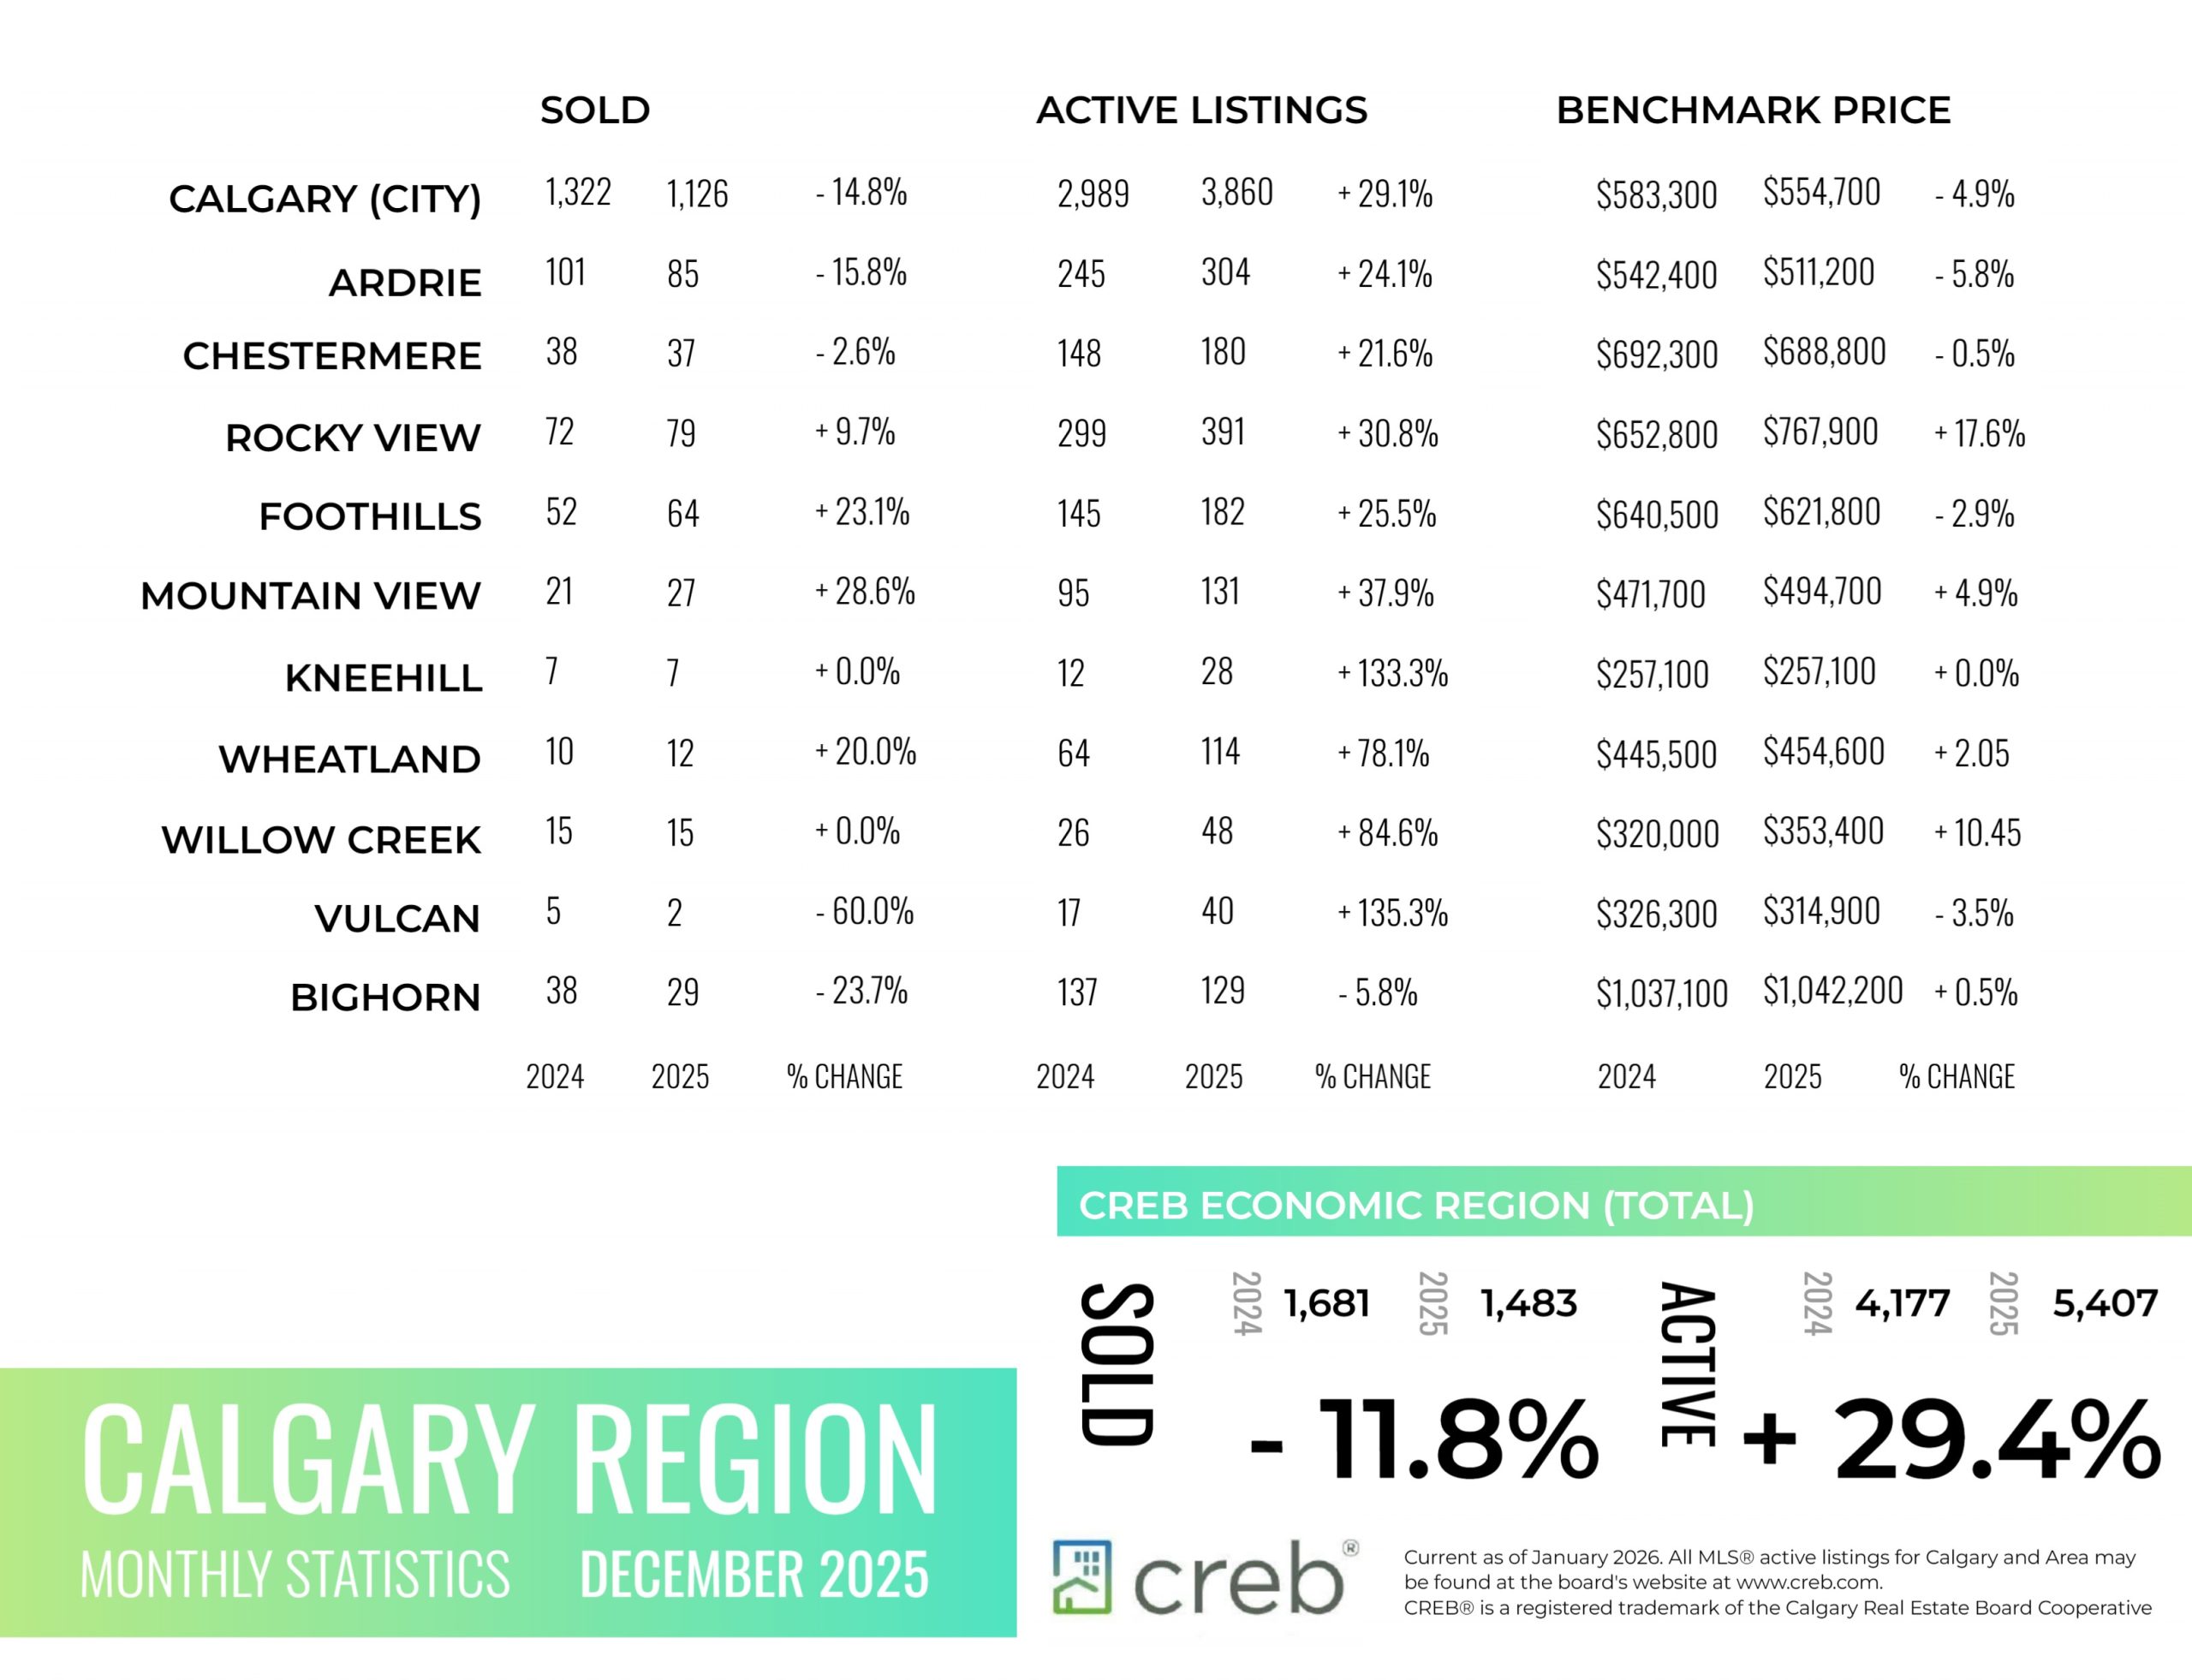
INFOGRAPHICS: December 2025 CREB City And Region Market Reports
2025 housing market shifted to more balanced conditions
Following several years of strong price growth, 2025 marked a year of transition thanks to strong demand and limited supply. Due to record high starts, supply levels improved across all aspects of the housing market, just as demand pressure eased due to a reduction in migration levels and heightened uncertainty that persisted throughout the spring market. This helped shift the resale market from one that favoured the seller to one that was more balanced.
In 2025, sales reached 22,751 units, down 16 per cent over last year, but in-line with long-term trends. Much of the shift came from the growth in supply. 2025 saw over 40,000 new listings come onto the market, nine per cent higher than last year, causing inventories to rise and driving more balanced conditions.
“Supply levels were expected to rise in 2025. However, the growth was higher than expected especially for apartment condominium and row homes. This weighed on prices in those sectors enough to offset the annual gains reported for both detached and semi-detached homes,” said Ann-Marie Lurie, CREB®’s Chief Economist. “Adjustments in both supply and demand varied across the city, with pockets of the market continuing to experience seller’s market conditions versus some areas where the conditions favoured the buyer. This resulted in different price trends based on location, price range and property type.”
Read the full report on the CREB website!
The following data is a comparison between December 2025 and December 2024 numbers, and is current as of January of 2026. For last month’s numbers, check out our previous infographic.
Or follow this link for all our CREB Infographics!
Click on the images for a larger view!
Download Printable Version – December 2025 CREB, City of Calgary Report Pages 1 and 2
Download Printable Version – December 2025 CREB, Calgary Region Report


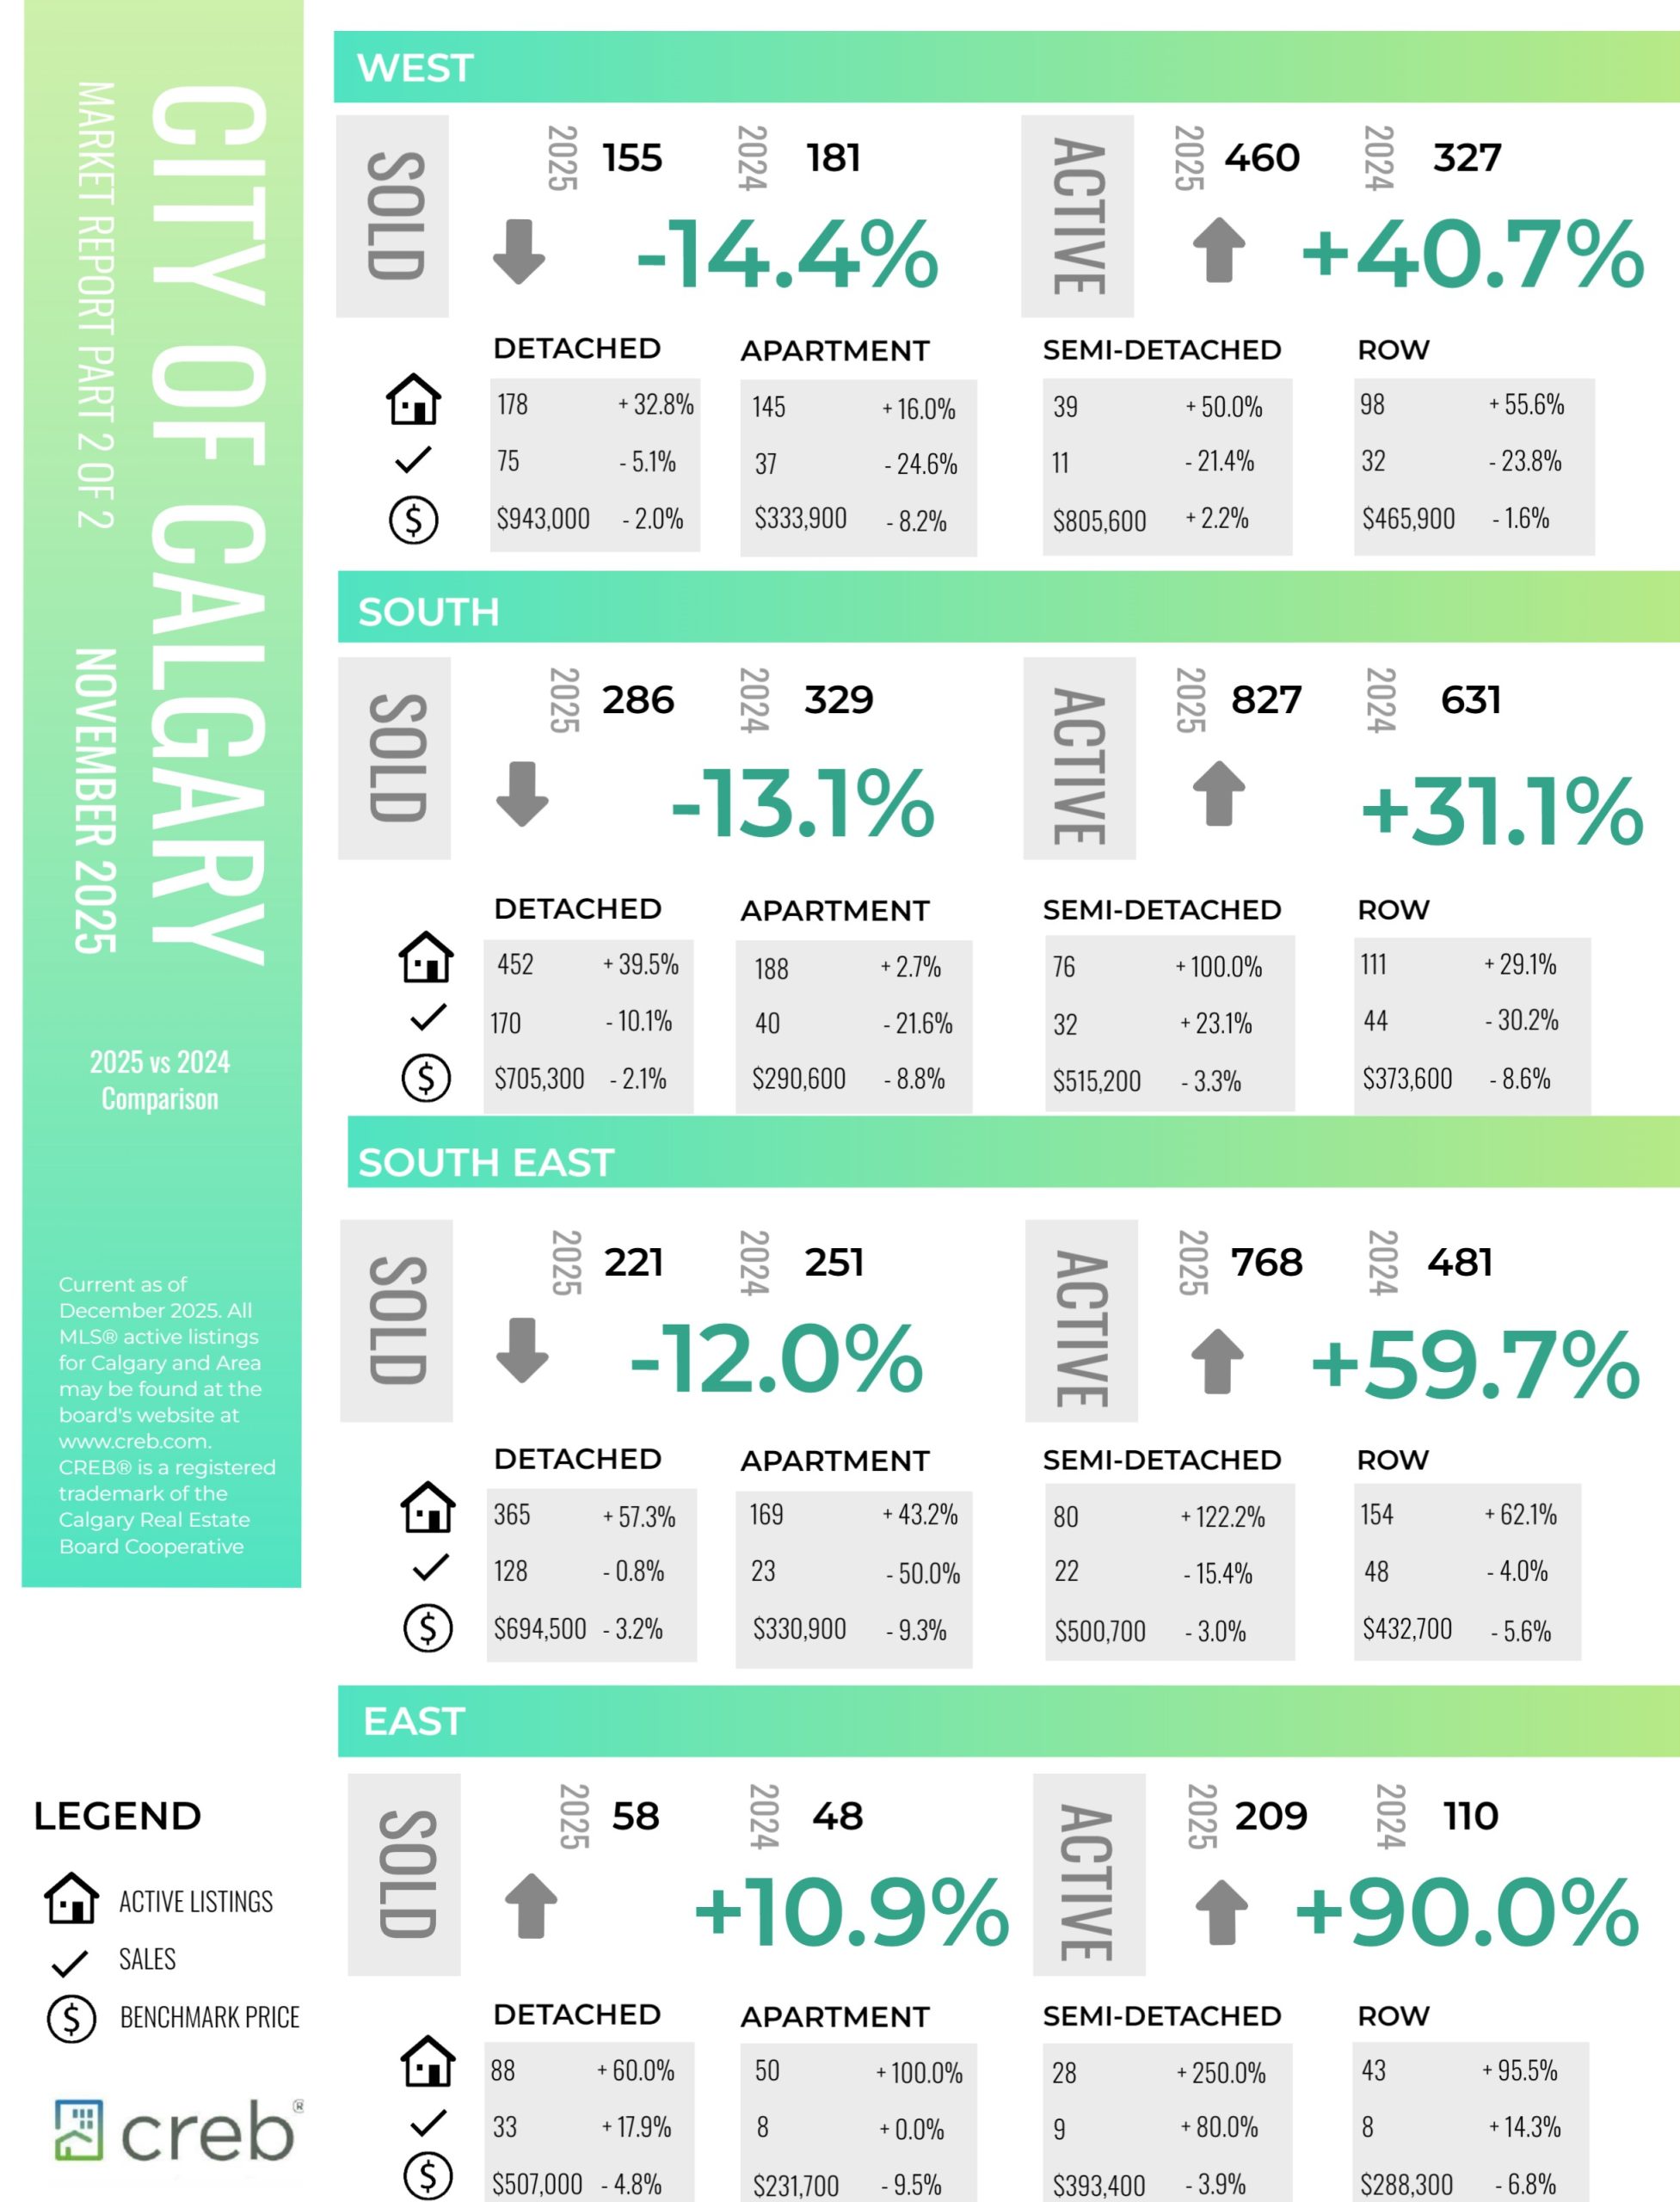
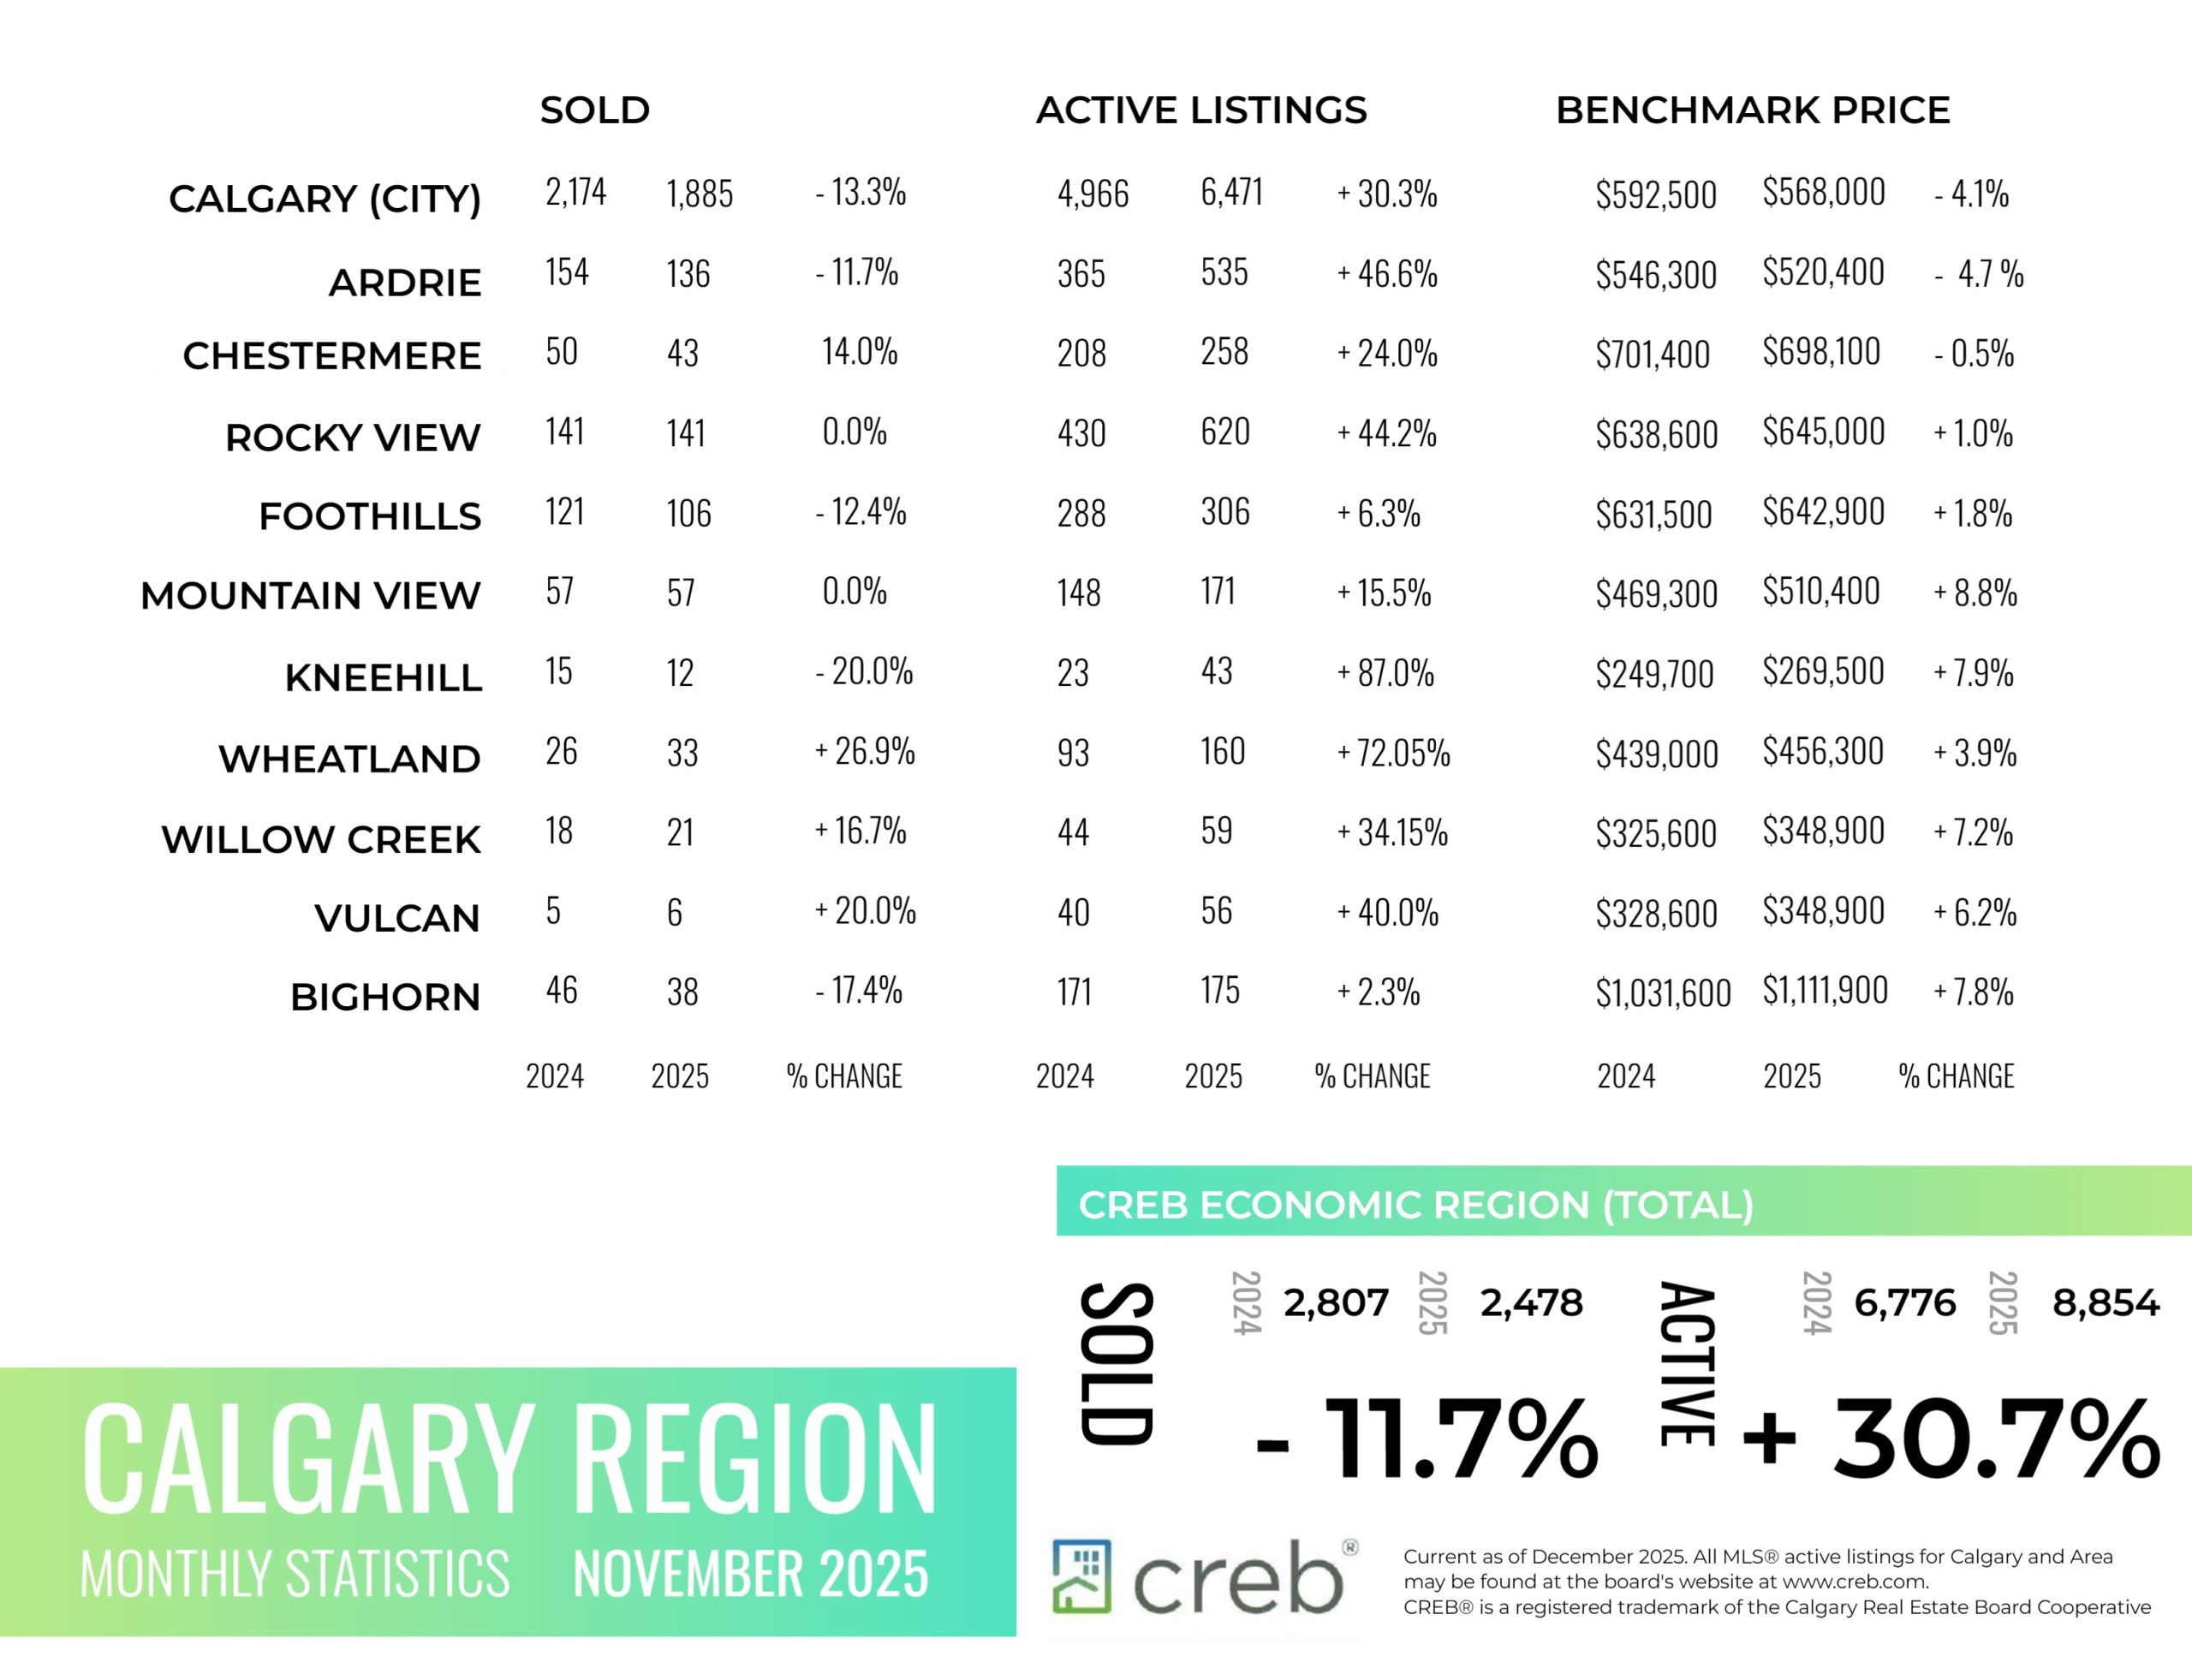
INFOGRAPHICS: November 2025 CREB City And Region Market Reports
Pace of new listings growth slows, preventing further inventory gains
Inventory levels eased over last month thanks to the combined impact of a monthly pullback in new listings and a monthly pick up in sales.
With 6,471 units in inventory and 1,885 sales the October months of supply returned to three-and-a-half months after pushing up to four months in September. While both row- and apartment-style properties continue to report elevated supply levels compared to demand, conditions remain relatively balanced for both detached and semi-detached properties.
Year-to-date sales in the city totaled 20,082, down nearly 16 per cent compared to last year, but still in line with longer-term trends. Much of the decline in sales has been driven by pullbacks for apartment- and row-style homes.
“Improved rental supply and easing rents have slowed ownership demand for apartment- and row-style homes. It is also these segments of the market that have seen October inventories reach a record high for the month,” said Ann-Marie Lurie, CREB®’s Chief Economist. “Excess supply for apartment- and row-style properties is weighing on prices in those segments more so than any other property type, influencing total residential prices.”
Read the full report on the CREB website!
The following data is a comparison between November 2025 and November 2024 numbers, and is current as of December of 2025. For last month’s numbers, check out our previous infographic.
Or follow this link for all our CREB Infographics!
Click on the images for a larger view!
Download Printable Version – November 2025 CREB, City of Calgary Report Pages 1 and 2
Download Printable Version – November 2025 CREB, Calgary Region Report

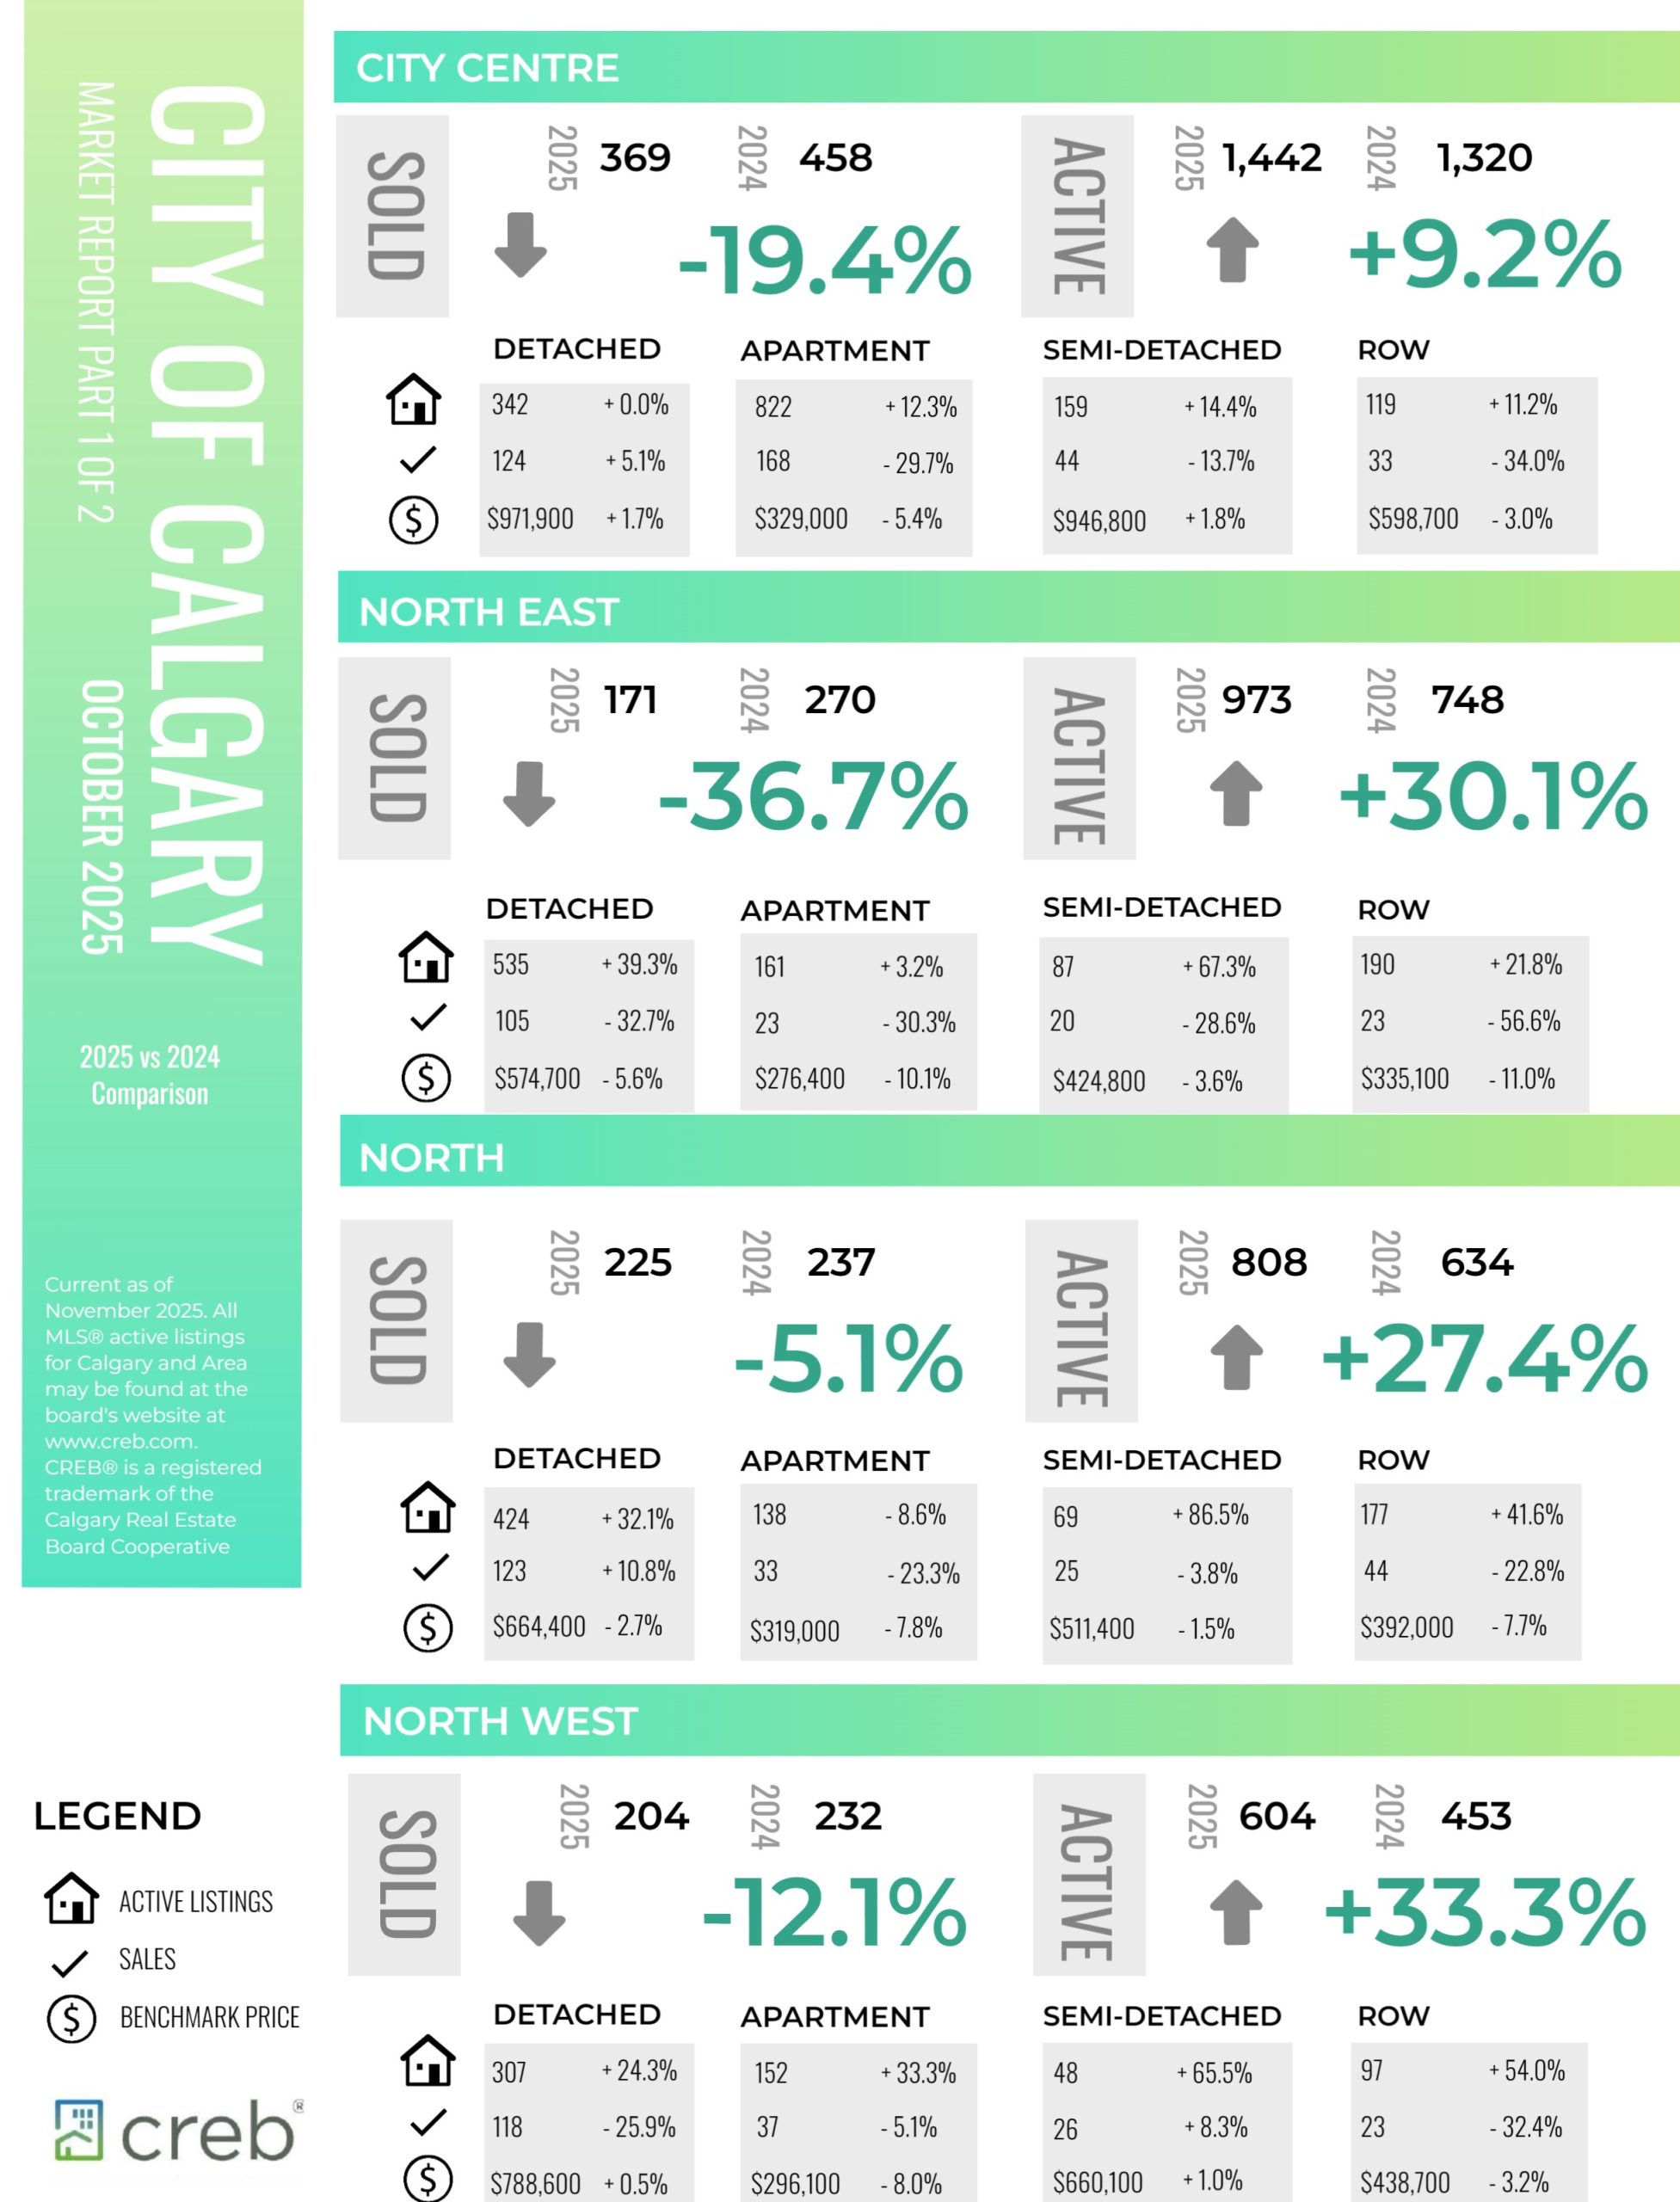
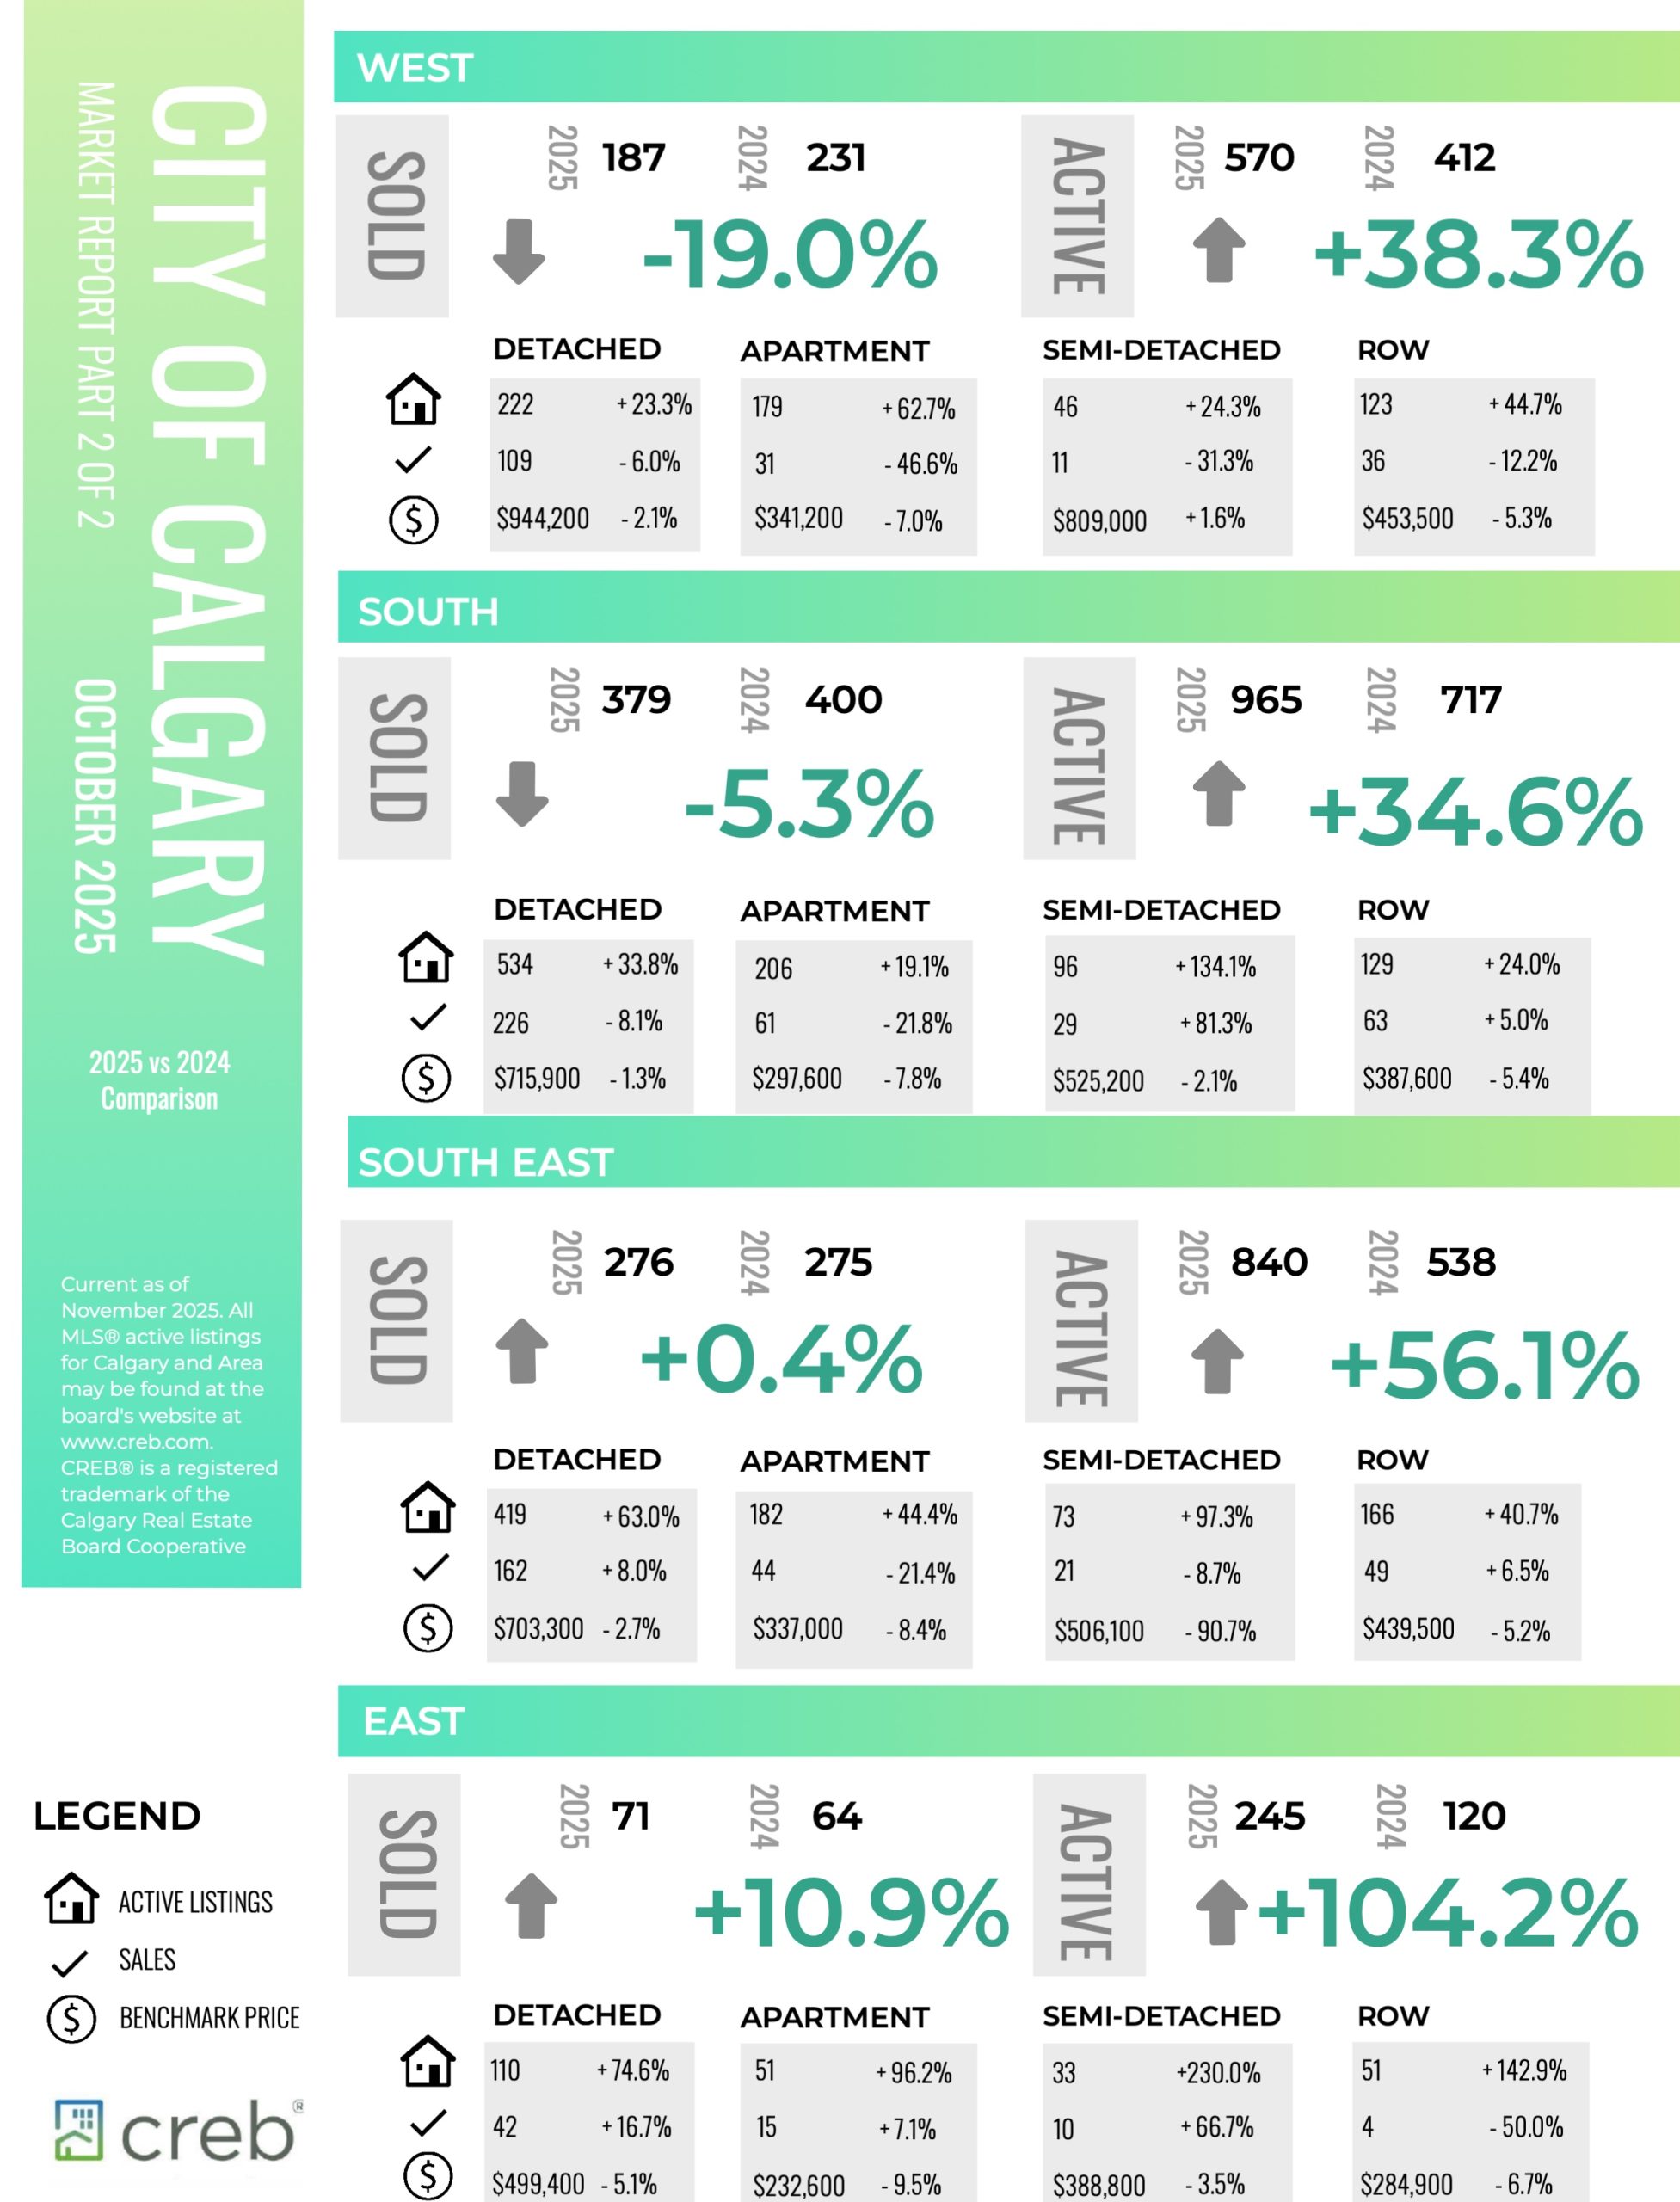
INFOGRAPHICS: October 2025 CREB City And Region Market Reports
Pace of new listings growth slows, preventing further inventory gains
Inventory levels eased over last month thanks to the combined impact of a monthly pullback in new listings and a monthly pick up in sales.
With 6,471 units in inventory and 1,885 sales the October months of supply returned to three-and-a-half months after pushing up to four months in September. While both row- and apartment-style properties continue to report elevated supply levels compared to demand, conditions remain relatively balanced for both detached and semi-detached properties.
Year-to-date sales in the city totaled 20,082, down nearly 16 per cent compared to last year, but still in line with longer-term trends. Much of the decline in sales has been driven by pullbacks for apartment- and row-style homes.
“Improved rental supply and easing rents have slowed ownership demand for apartment- and row-style homes. It is also these segments of the market that have seen October inventories reach a record high for the month,” said Ann-Marie Lurie, CREB®’s Chief Economist. “Excess supply for apartment- and row-style properties is weighing on prices in those segments more so than any other property type, influencing total residential prices.”
Read the full report on the CREB website!
The following data is a comparison between October 2025 and October 2024 numbers, and is current as of November of 2025. For last month’s numbers, check out our previous infographic.
Or follow this link for all our CREB Infographics!
Click on the images for a larger view!
Download Printable Version – October 2025 CREB, City of Calgary Report Pages 1 and 2
Download Printable Version – October 2025 CREB, Calgary Region Report

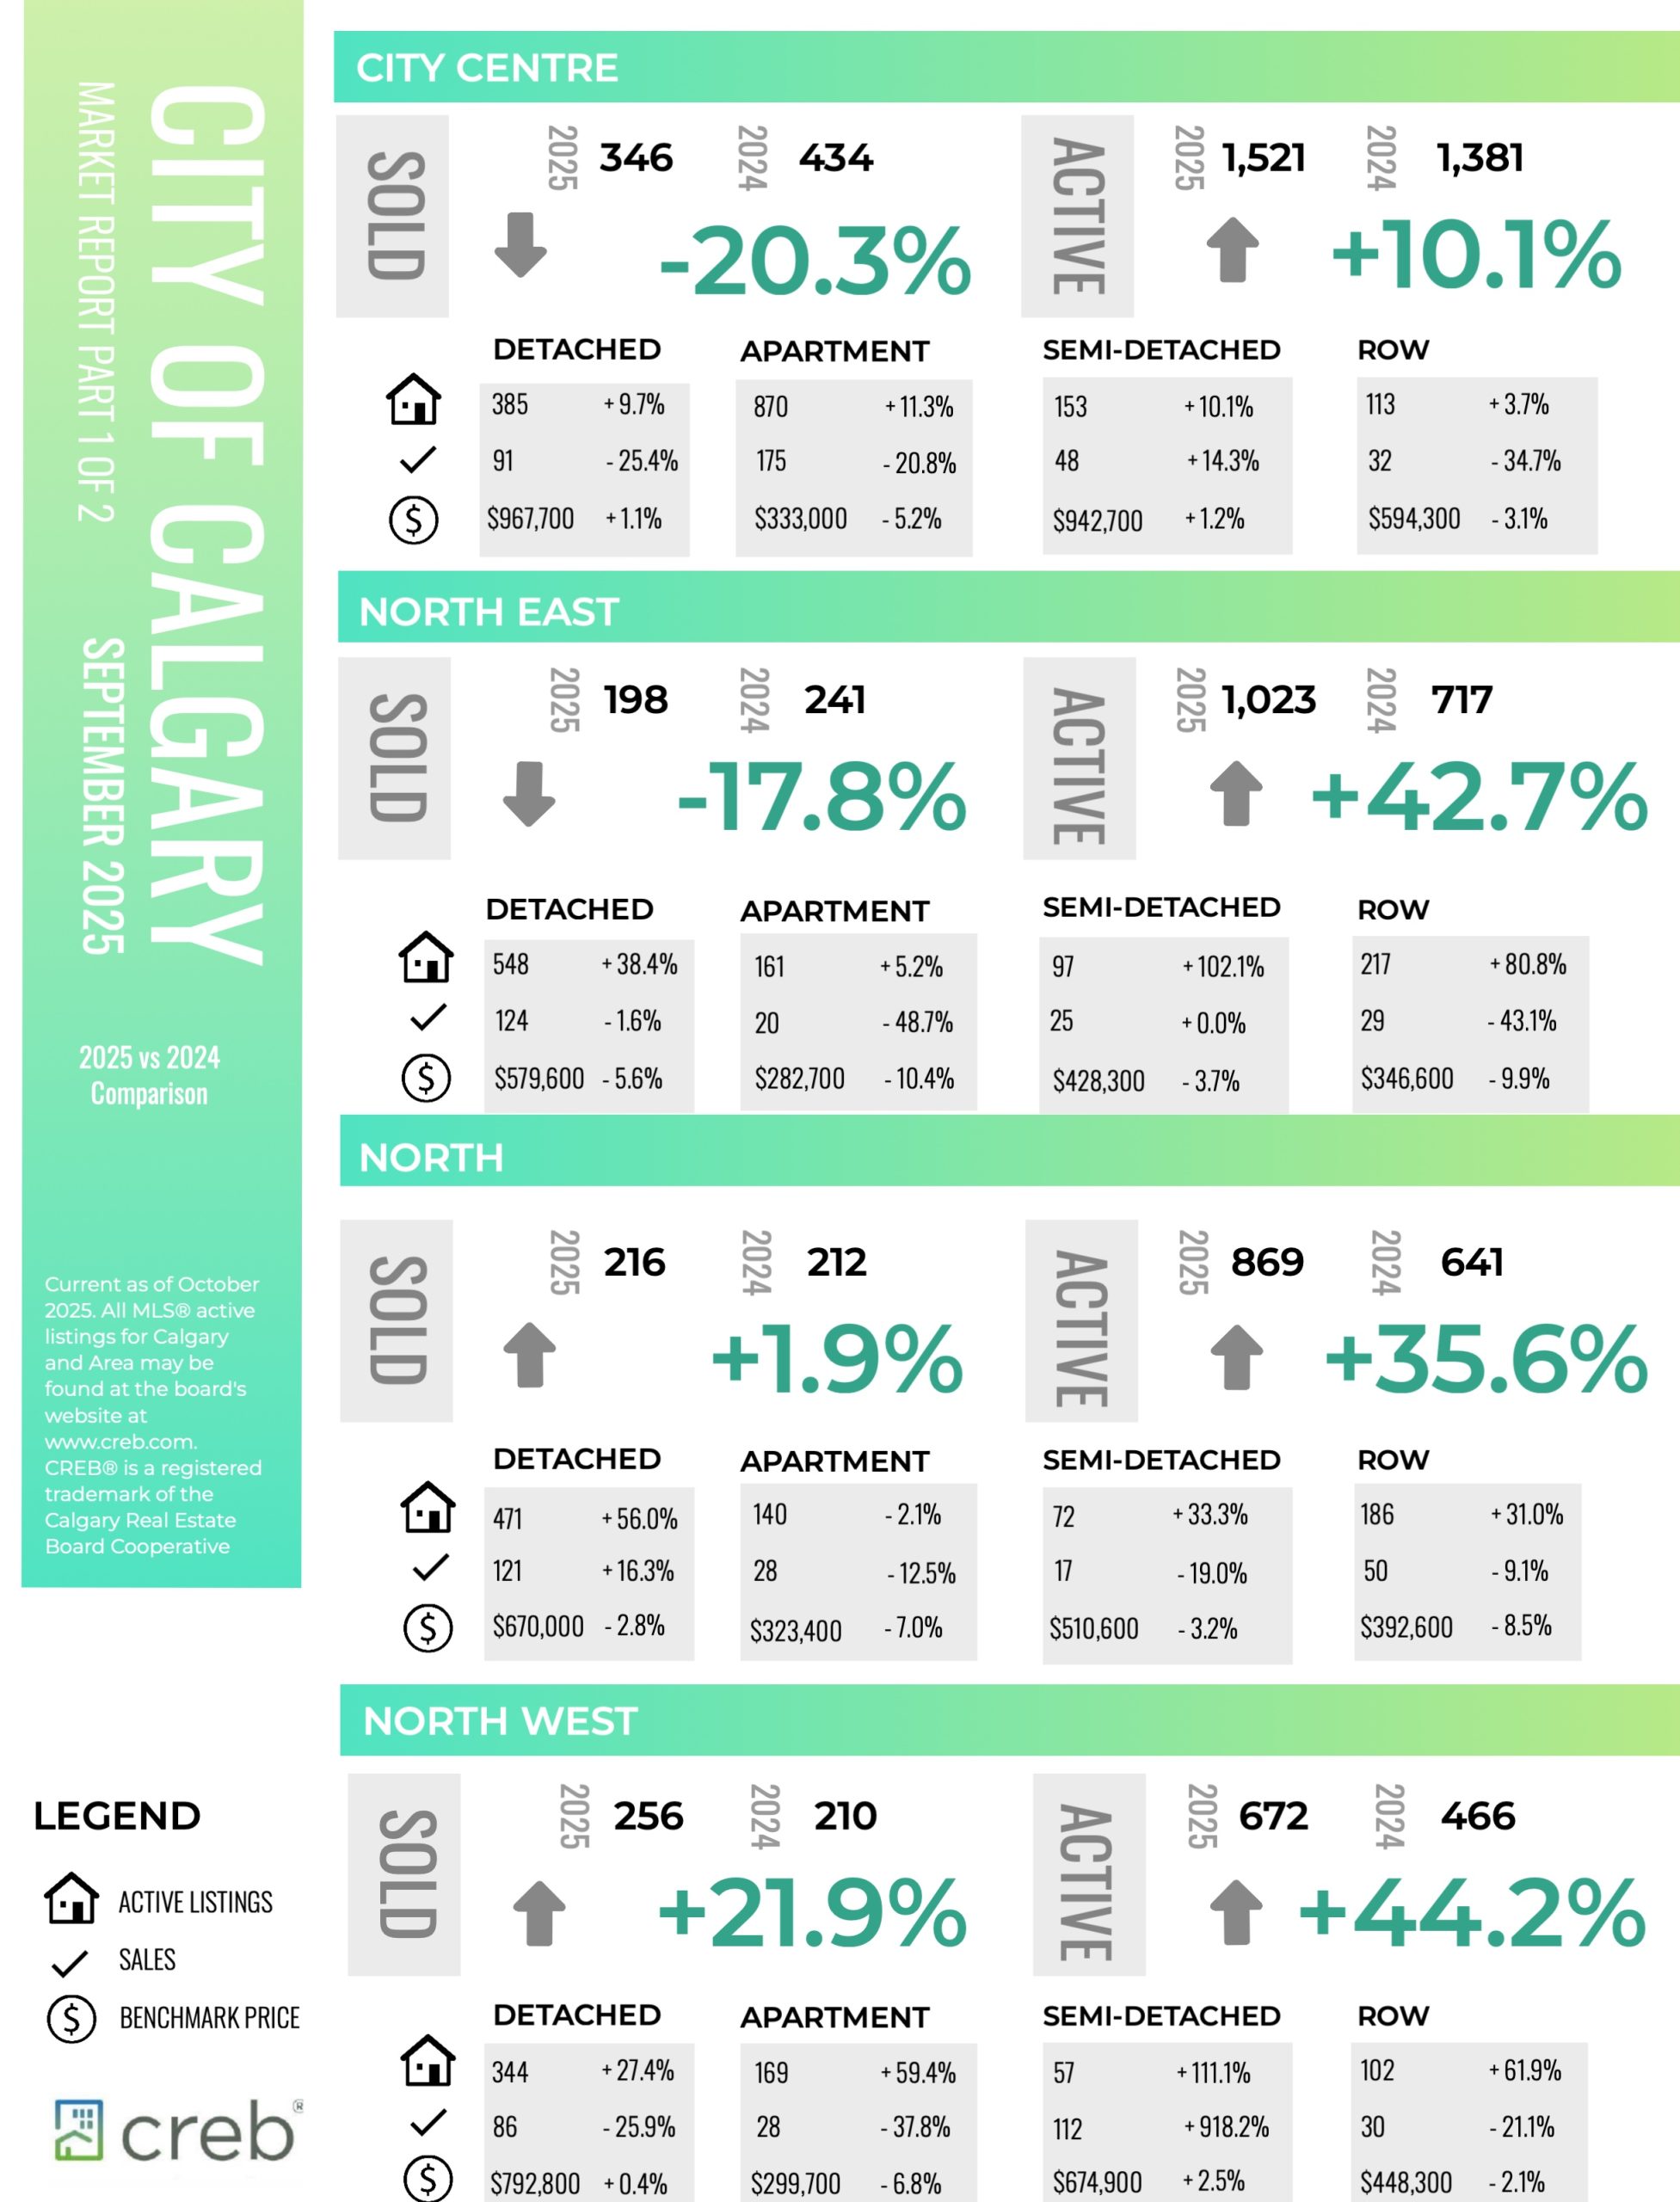
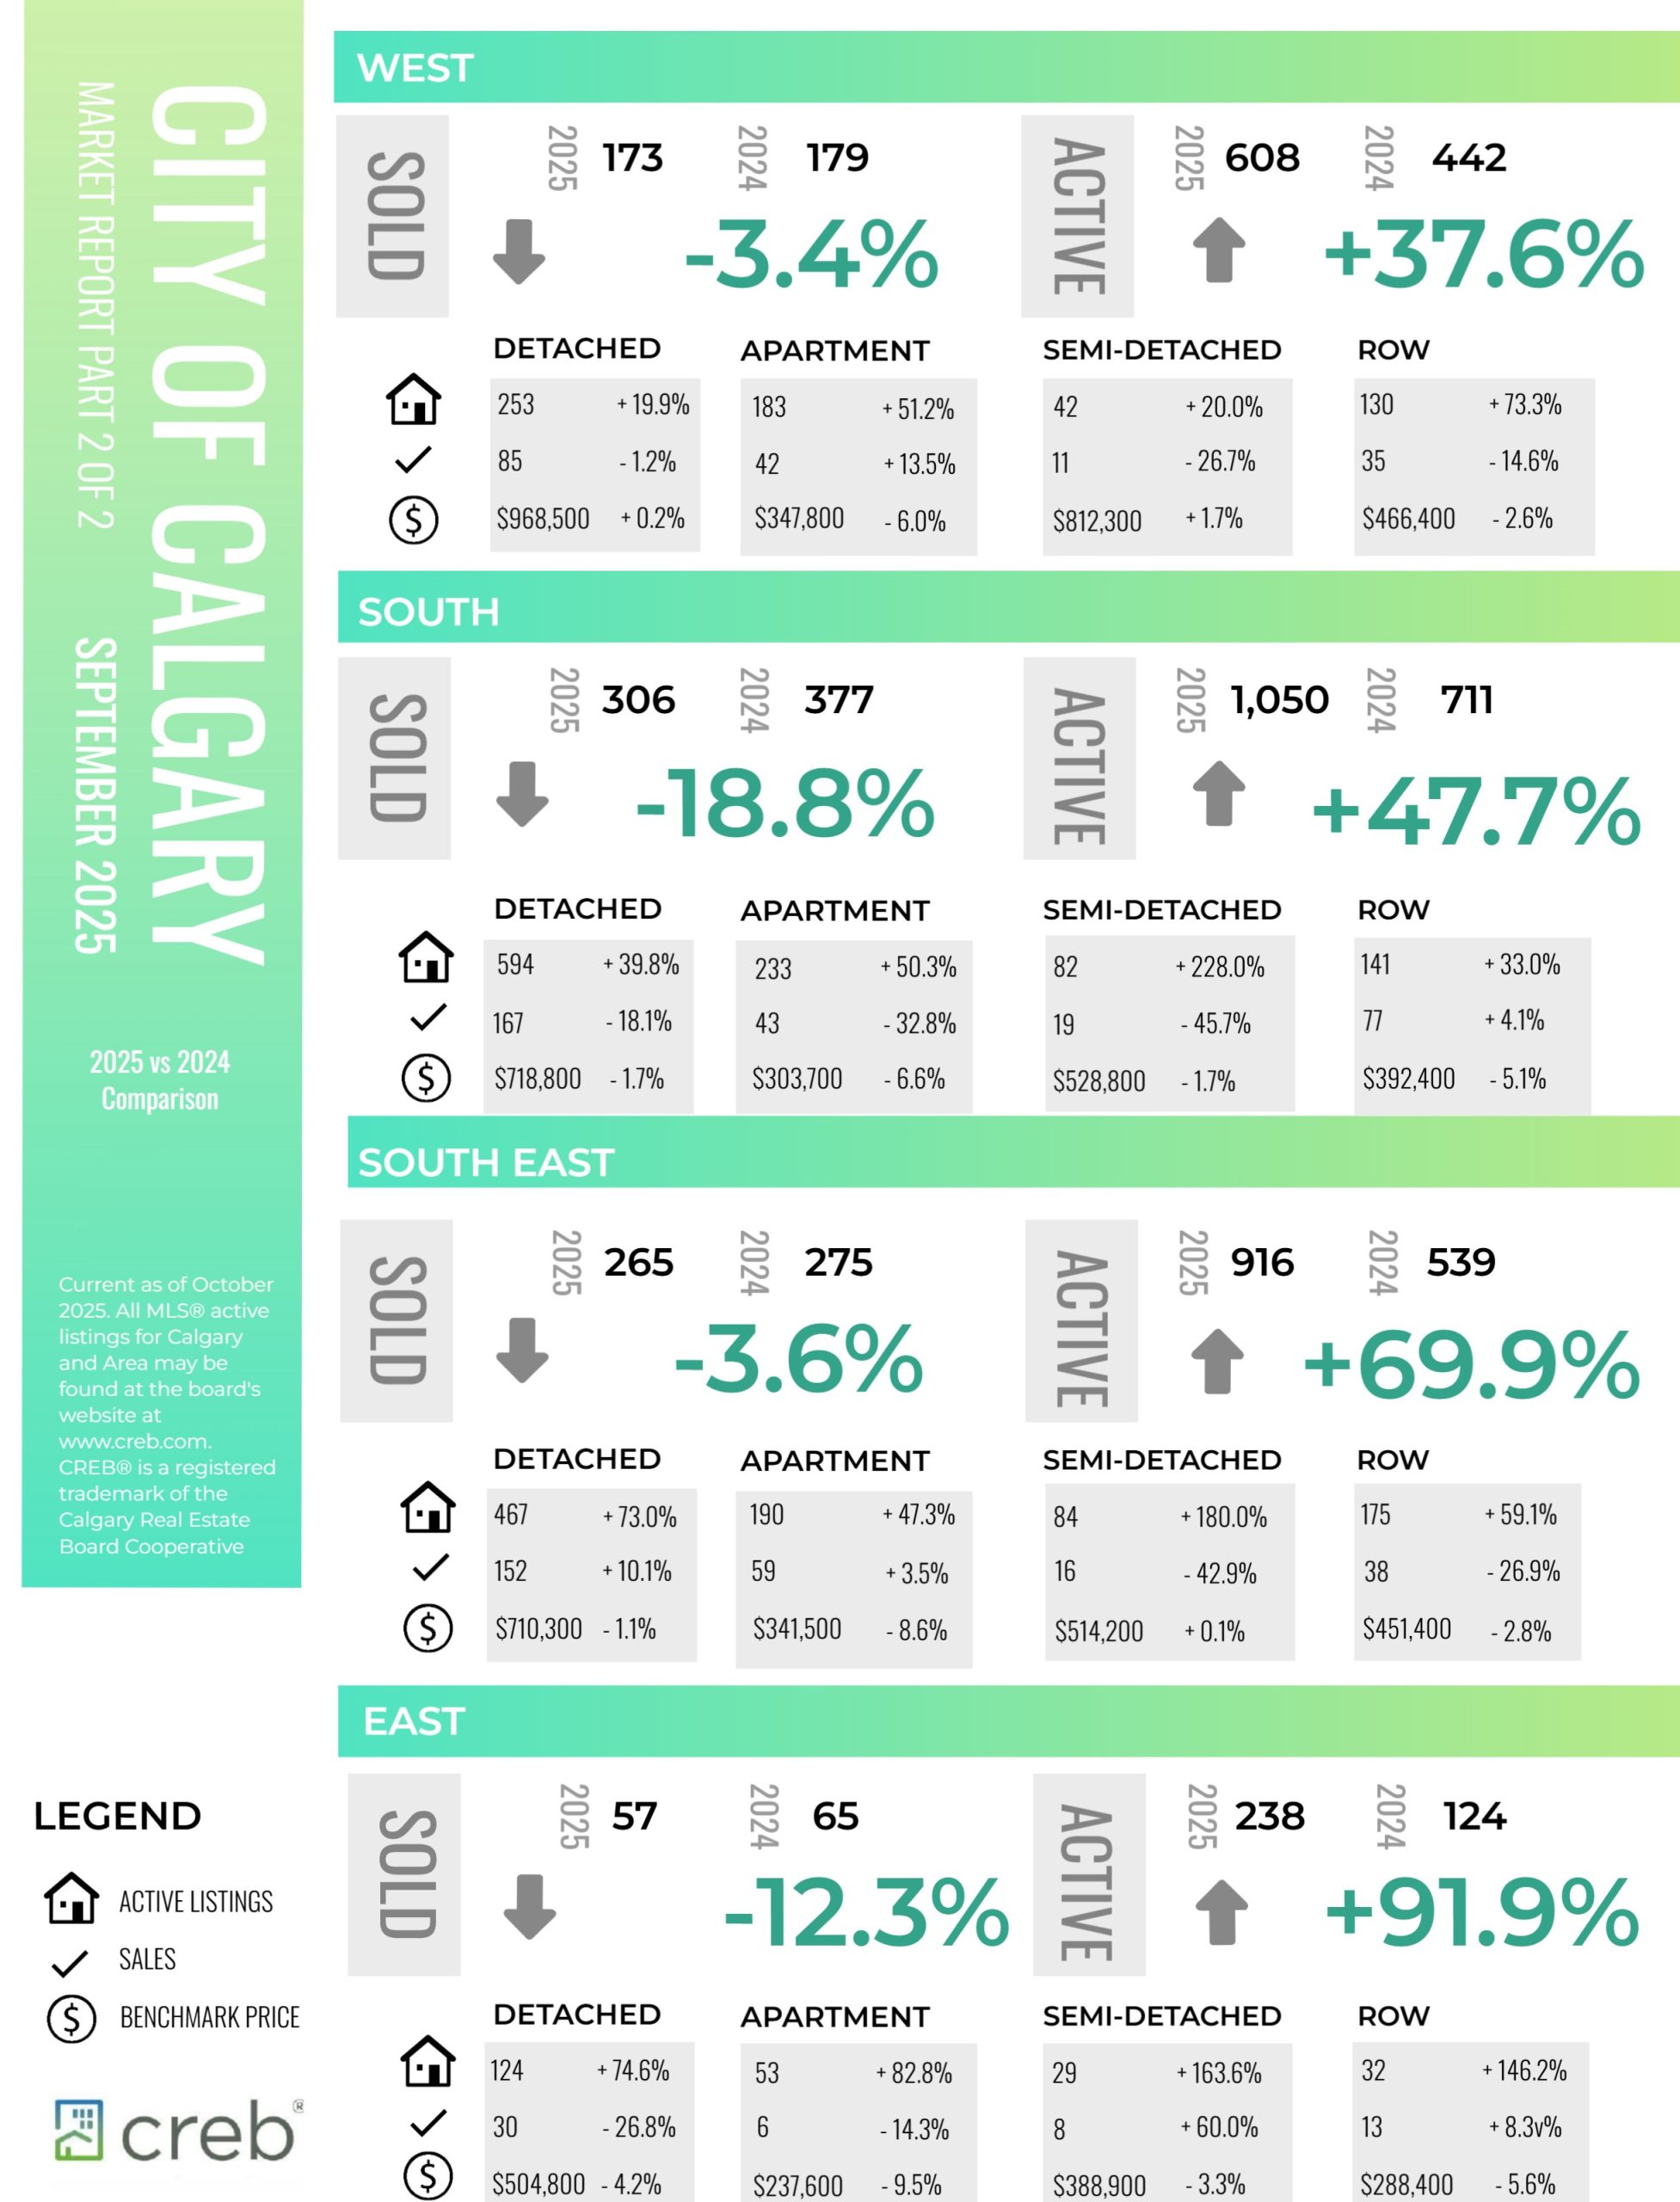
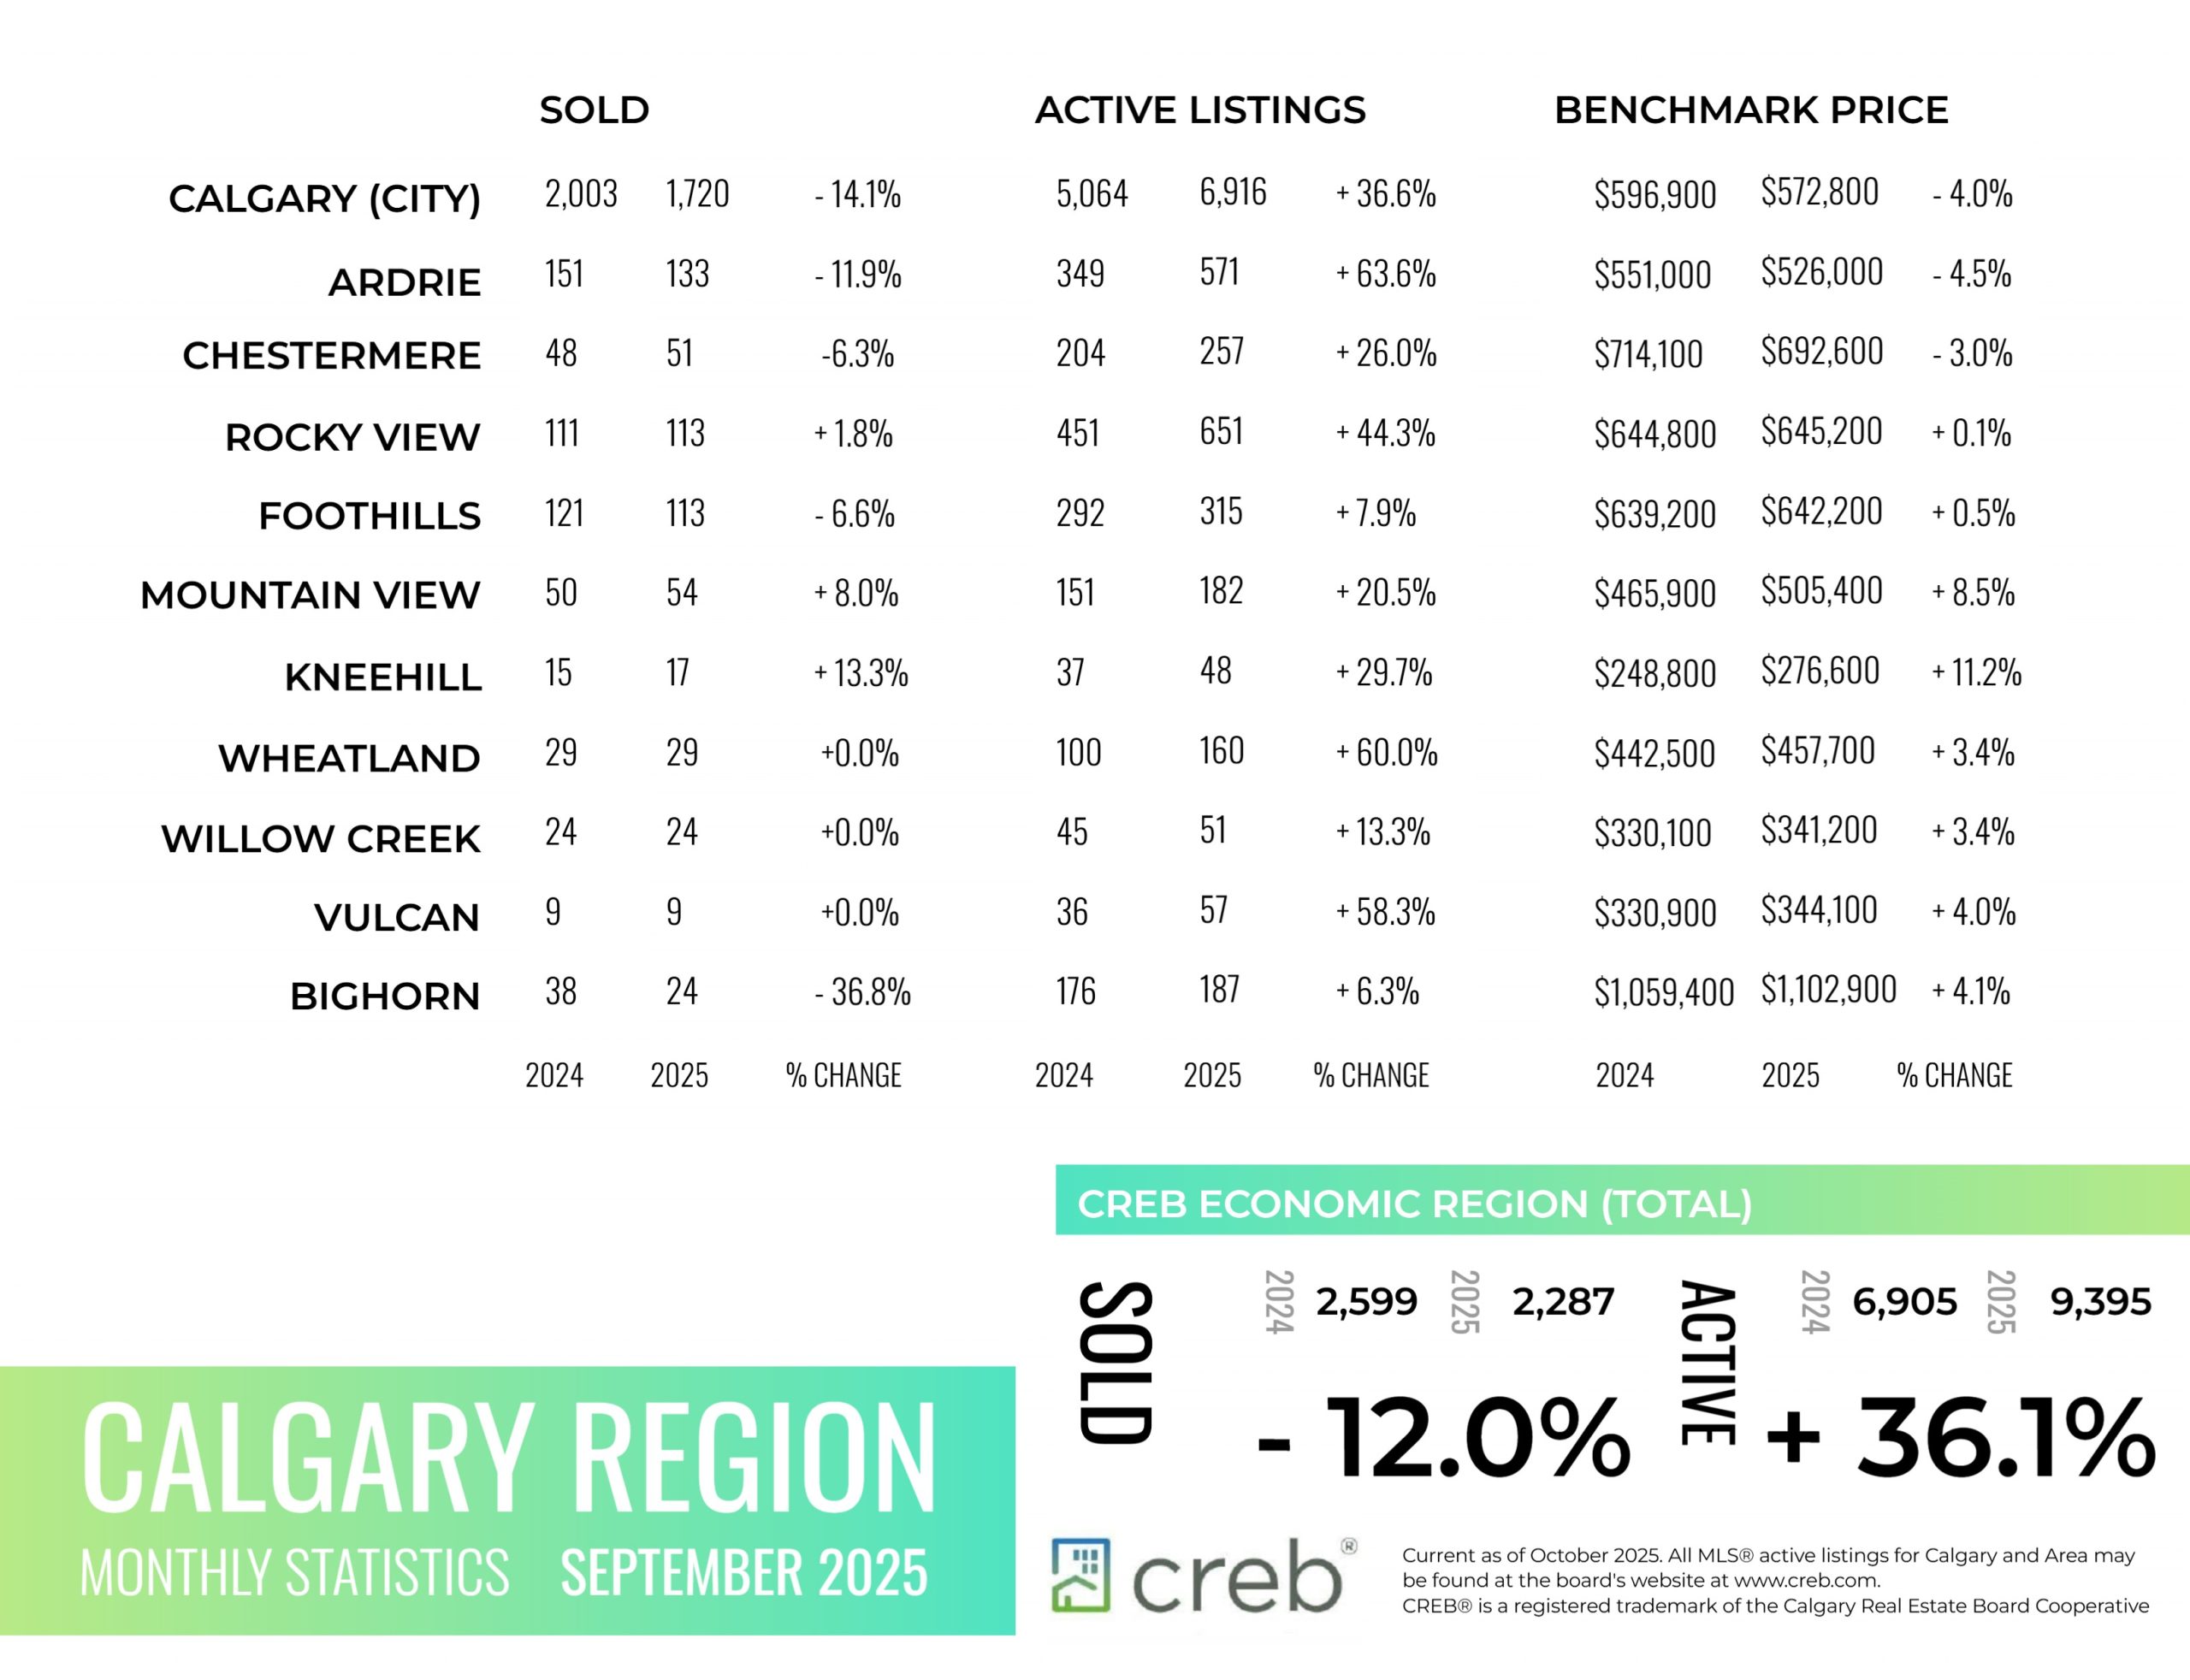
INFOGRAPHICS: September 2025 CREB City And Region Market Reports
A boost in new listings drives further inventory gains and price adjustments
The 1,720 sales in September were not high enough to offset the 3,782 new listings coming onto the market, driving further inventory gains as we move into the fall. There were 6,916 units in inventory in September, 36 per cent higher than last year and over 17 per cent higher than levels traditionally reported in September. Both row and apartment style homes have reported the largest boost in supply compared to long-term trends.
“Supply levels have been rising in the resale, new home and rental markets. The additional supply choice is coming at a time when demand is slowing, mostly due to slower population growth and persistent uncertainty. Resale markets have more competition from new homes and additional supply in the rental market, reducing the sense of urgency amongst potential purchasers. Ultimately, the additional supply choice is weighing on home prices,” said Ann-Marie Lurie, CREB® Chief Economist.
Supply levels relative to demand typically drive shifts in home prices. In September, the sales to new listings ratio dipped to 45 per cent, and the months of supply pushed up to four months for the first time since early 2020. This is a higher level of supply compared to demand than is typically seen in the Calgary market and, should this persist, we could see a market that shifts more in favour of the buyer. However, conditions do vary by property type, price range and location.
Read the full report on the CREB website!
The following data is a comparison between September 2025 and September 2024 numbers, and is current as of October of 2025. For last month’s numbers, check out our previous infographic.
Or follow this link for all our CREB Infographics!
Click on the images for a larger view!
Download Printable Version – September 2025 CREB, City of Calgary Report Pages 1 and 2
Download Printable Version – September 2025 CREB, Calgary Region Report
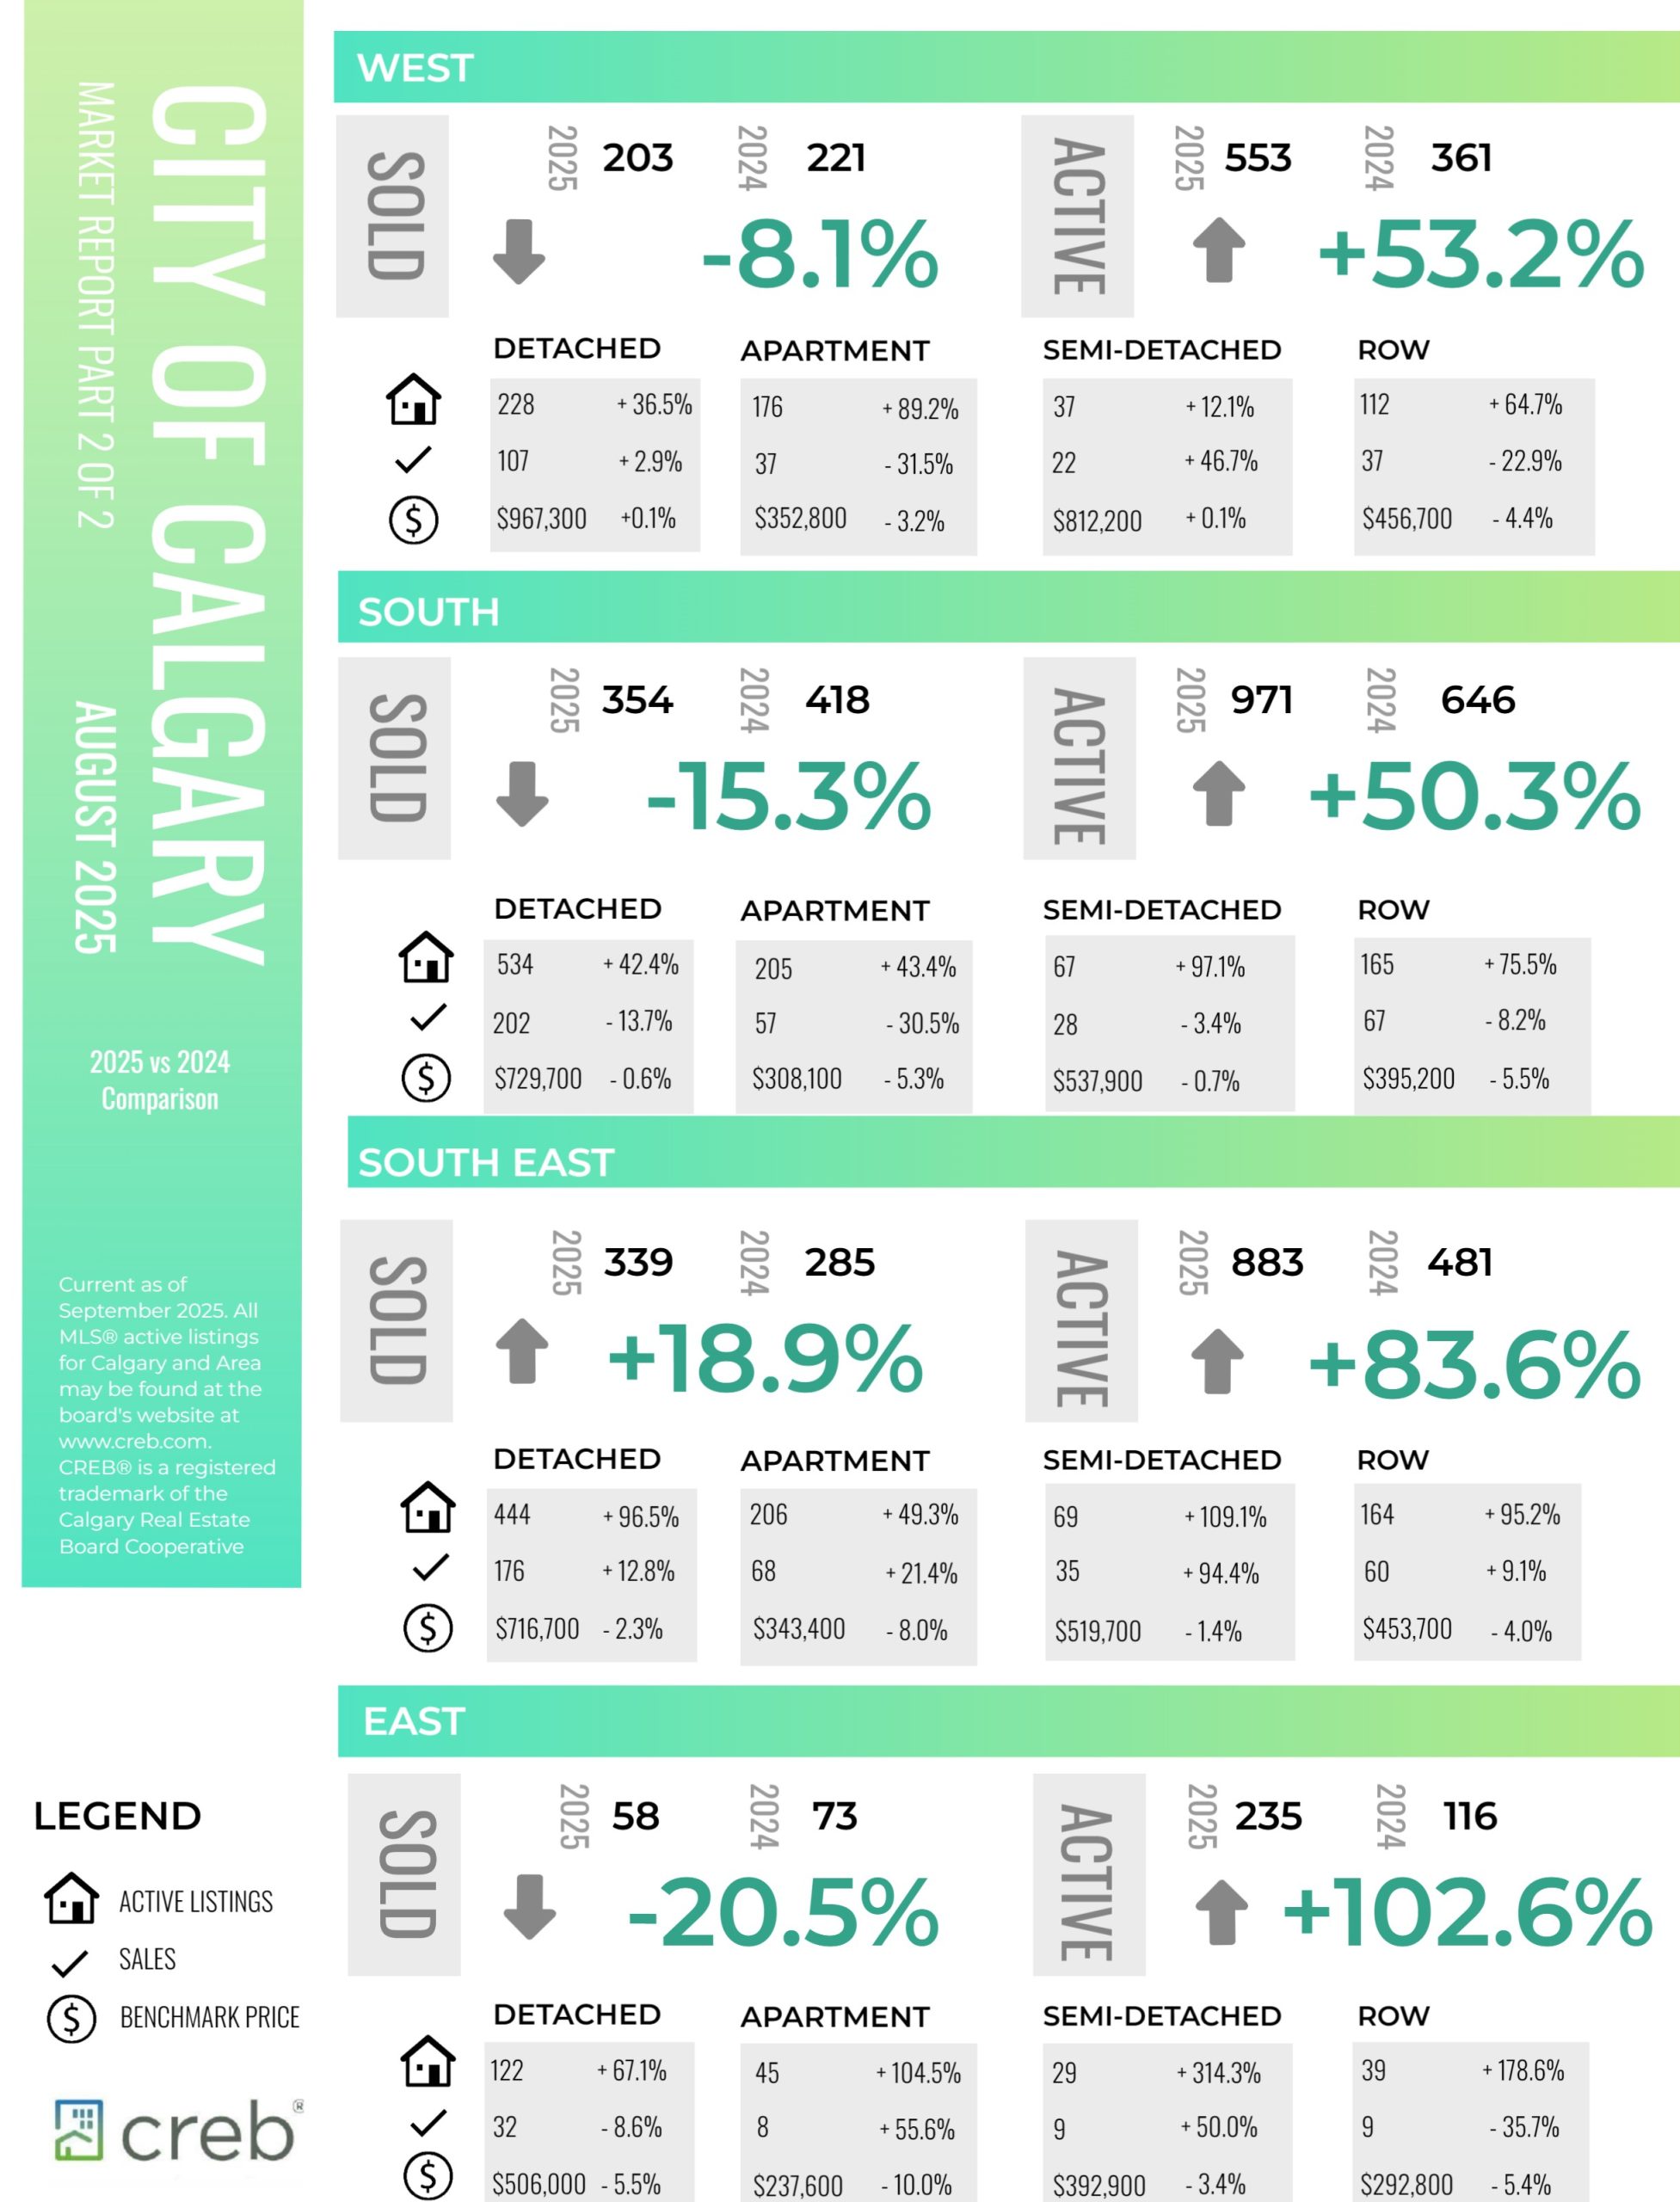
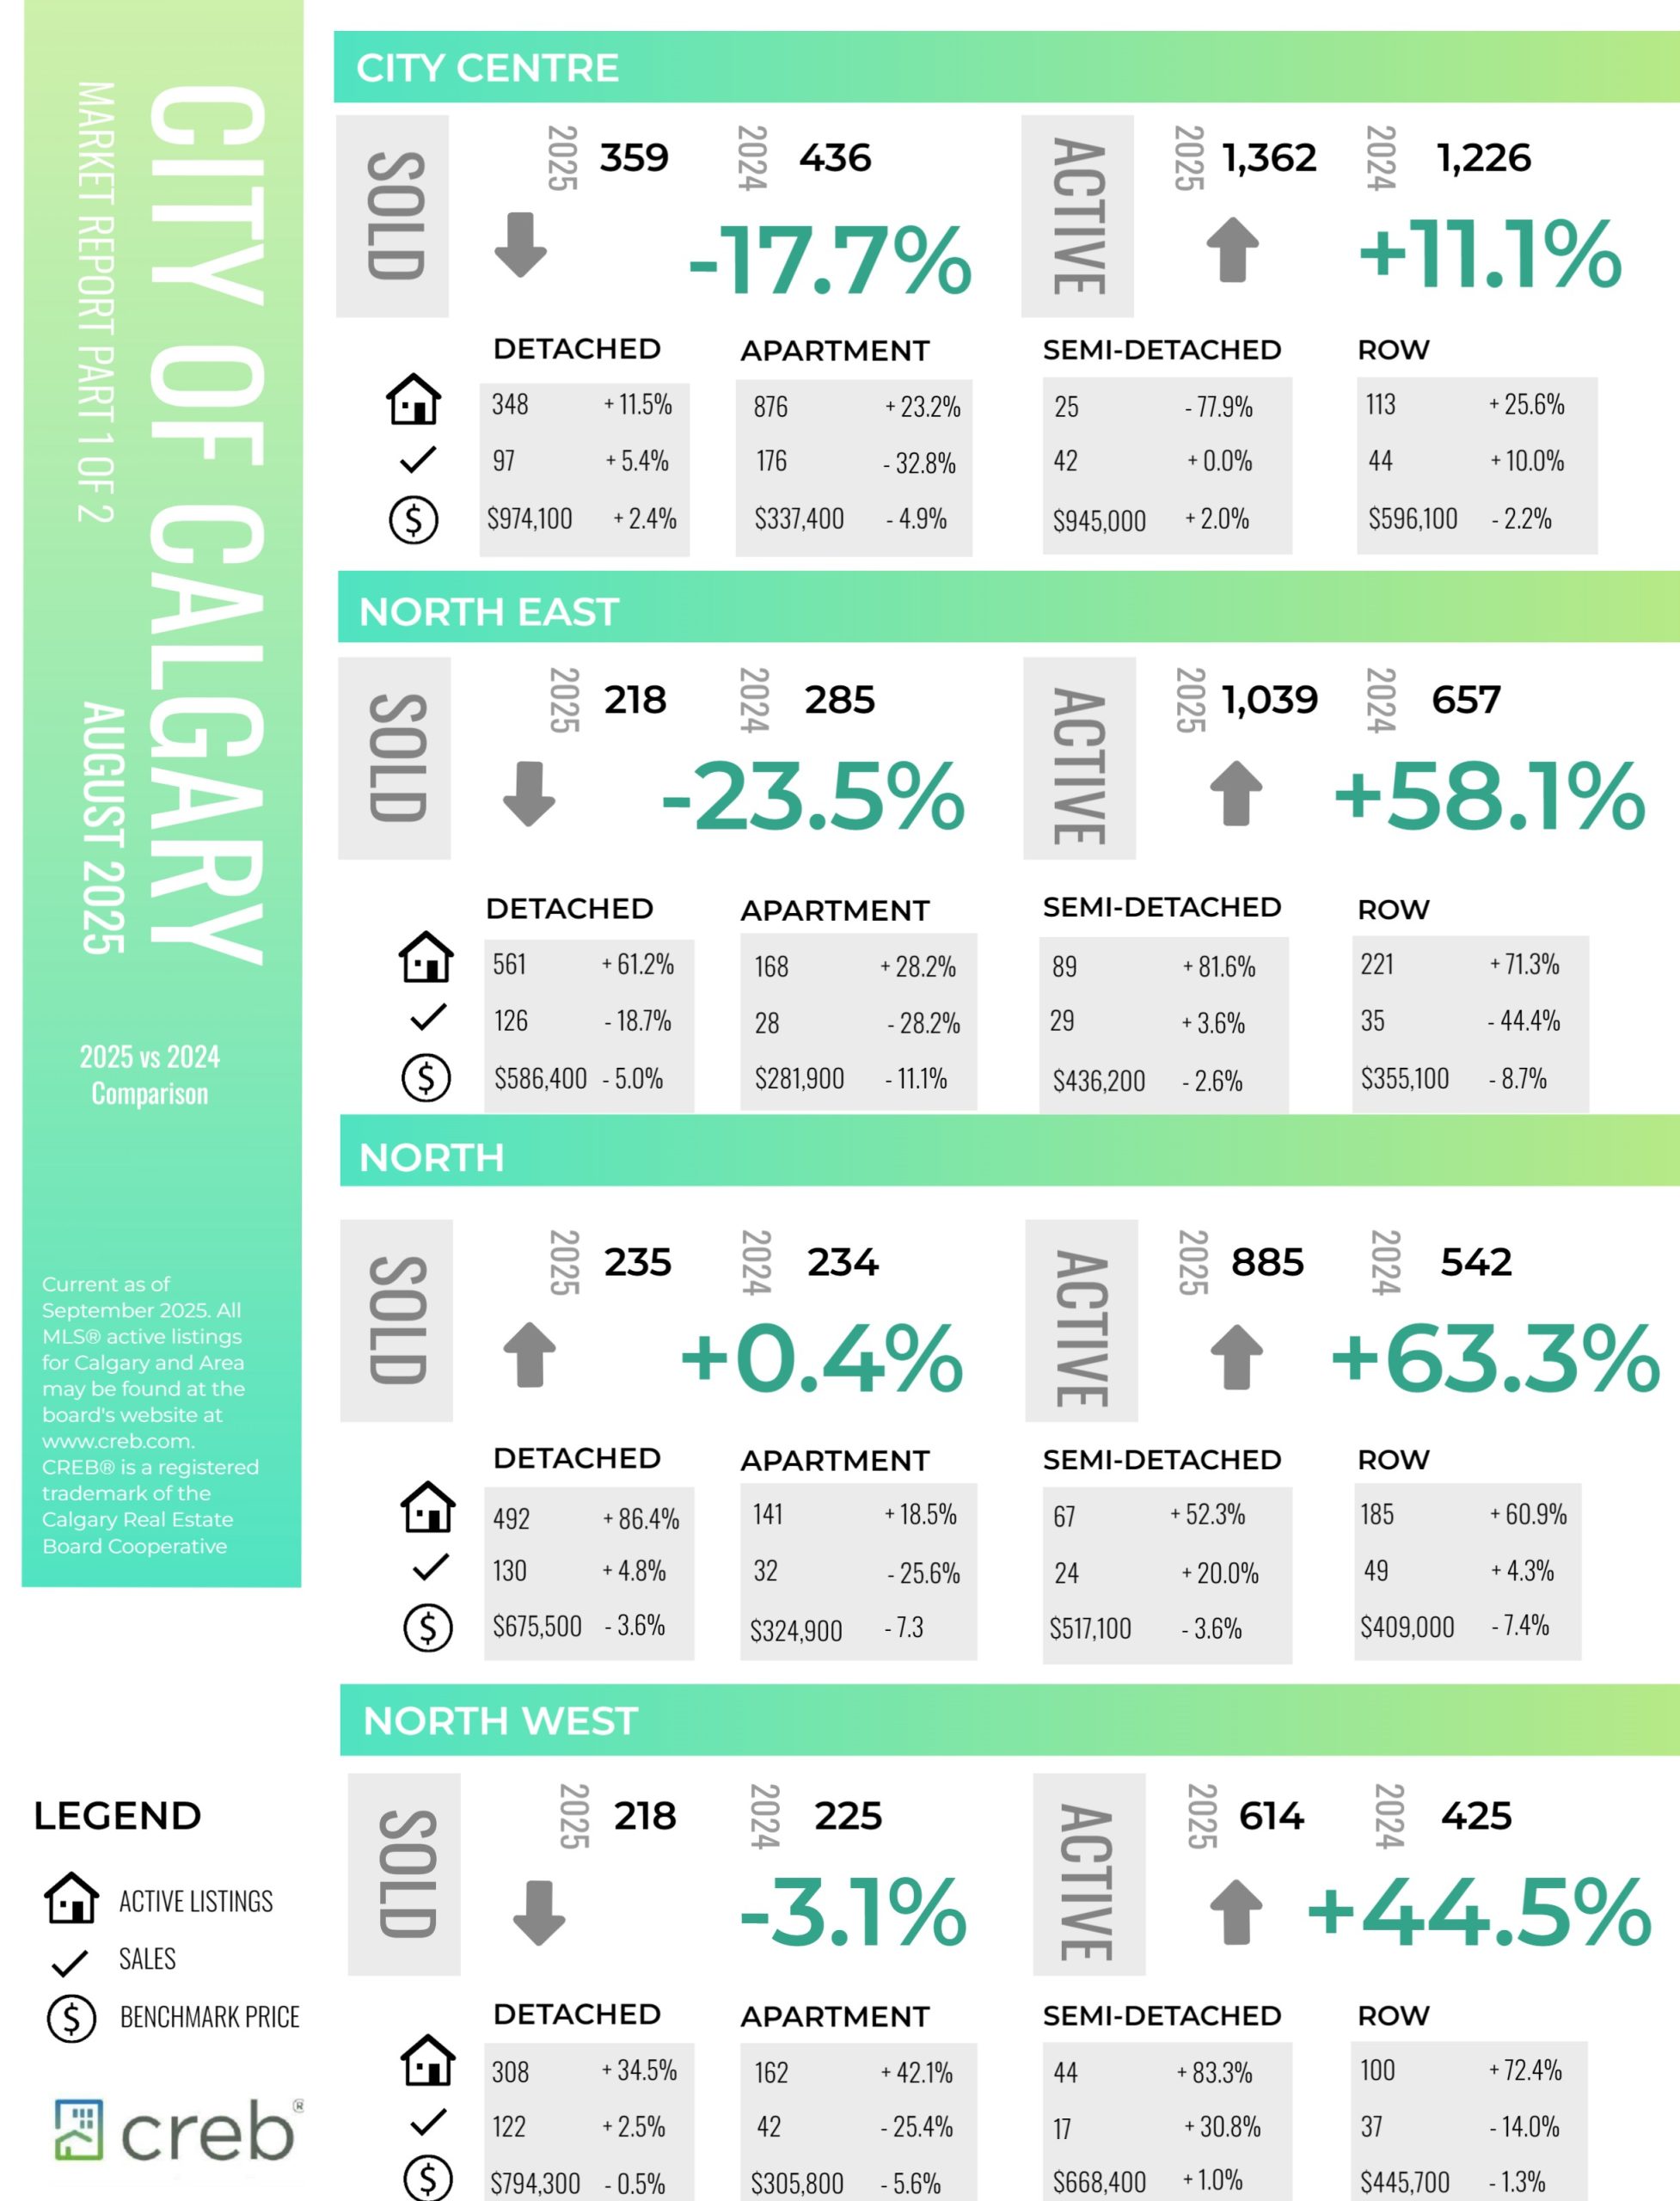
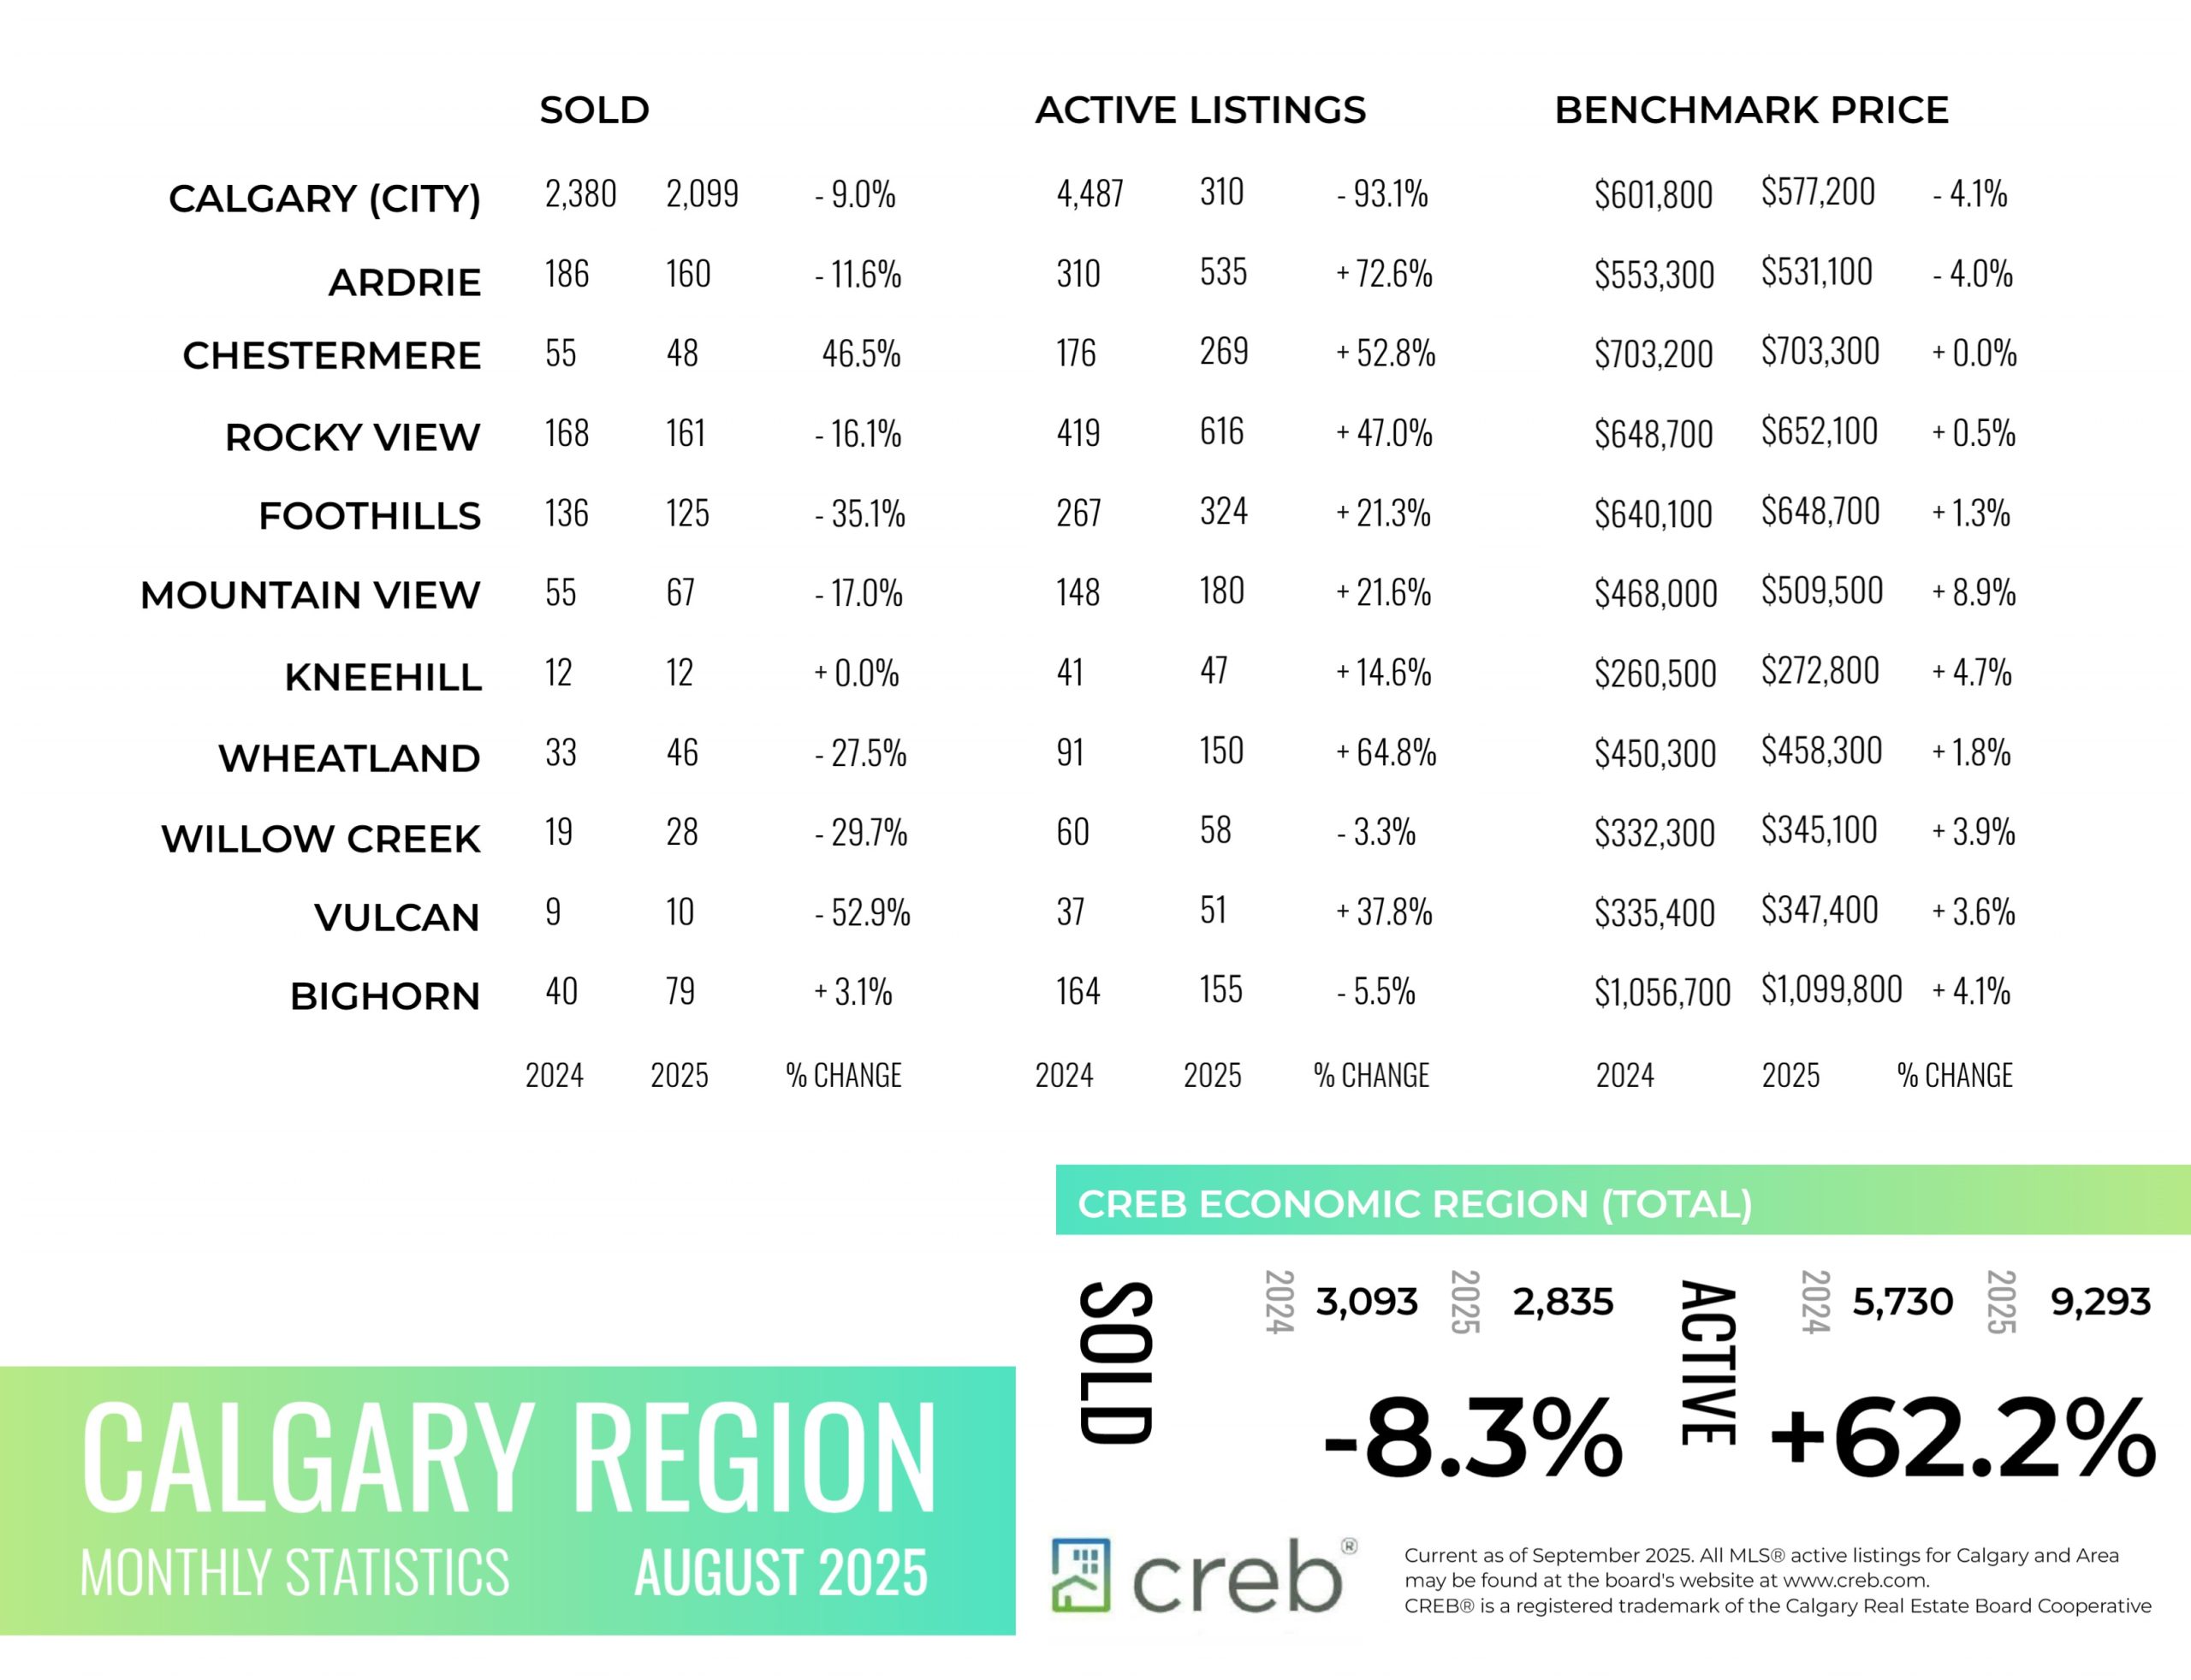
INFOGRAPHICS: August 2025 CREB City And Region Market Reports
Price declines mostly driven by higher density home types
Improving supply choice has changed the dynamics of the Calgary market driving price declines over the past several months.
Higher price adjustments are occurring for apartment and row style properties while detached and semi-detached properties have reported modest declines. As of August, the unadjusted total residential benchmark price was $577,200, down over last month and nearly four per cent lower than levels reported last year.
“Perspective is needed when it comes to price adjustments. The most significant price adjustments are occurring for row and apartment style homes as they are also the product type that are facing the largest gains in supply choice,” said Ann-Marie Lurie, Chief Economist at CREB®. “Meanwhile price adjustments in the detached and semi-detached markets range from modest price growth in some areas to larger price declines in areas with large supply growth. Overall, recent price adjustments have not offset all the gains that have occurred over the past several years.”
August reported 1,989 sales, nearly nine per cent lower than last year. Sales have slowed compared to the high levels reported over the past four years. However, activity is still above long-term trends, reflecting relatively strong demand. What has changed is the supply situation. New listings remain elevated, keeping the sales-to-new-listings ratio below 60 per cent and pushing inventory to 6,661, the highest August amount since 2019.
Read the full report on the CREB website!
The following data is a comparison between August 2025 and August 2024 numbers, and is current as of September of 2025. For last month’s numbers, check out our previous infographic.
Or follow this link for all our CREB Infographics!
Click on the images for a larger view!
Download Printable Version – August 2025 CREB, City of Calgary Report Pages 1 and 2
Download Printable Version – August 2025 CREB, Calgary Region Report